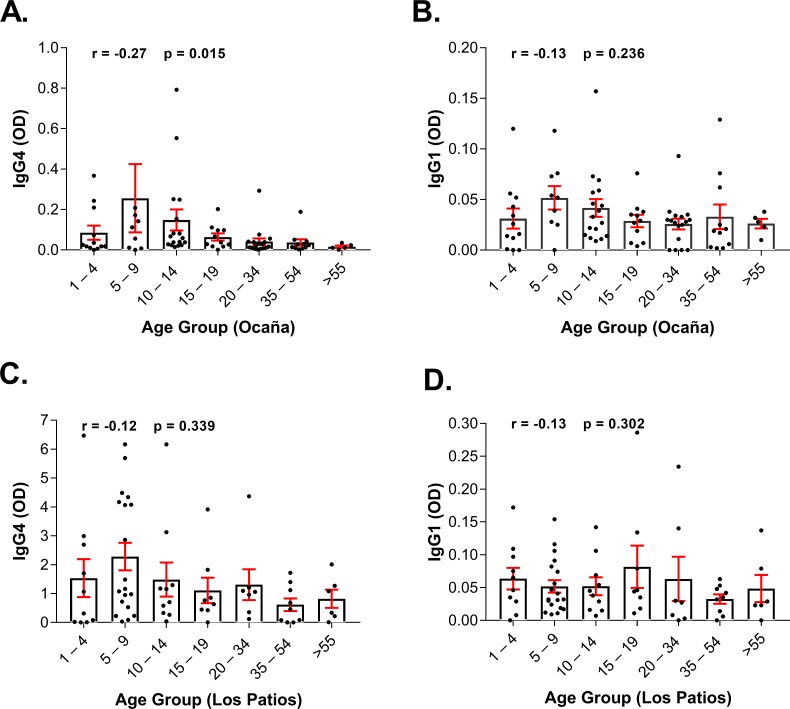
Fig 1. IgG4 and IgG1 antibody responses to Aedes aegypti salivary gland extracts according to age in Los Patios and Ocaña.
The distribution according to age of IgG4 and IgG1 specific to Aedes aegypti saliva is plotted for Los Patios (A and B, respectively) and for Ocaña (C and D, respectively). Individual responses are represented by the dark dots and boxes represent means of group individual antibody responses with their standard errors (vertical red bars). “r” and “p” values were obtained from the non-parametric Spearman correlation method.

