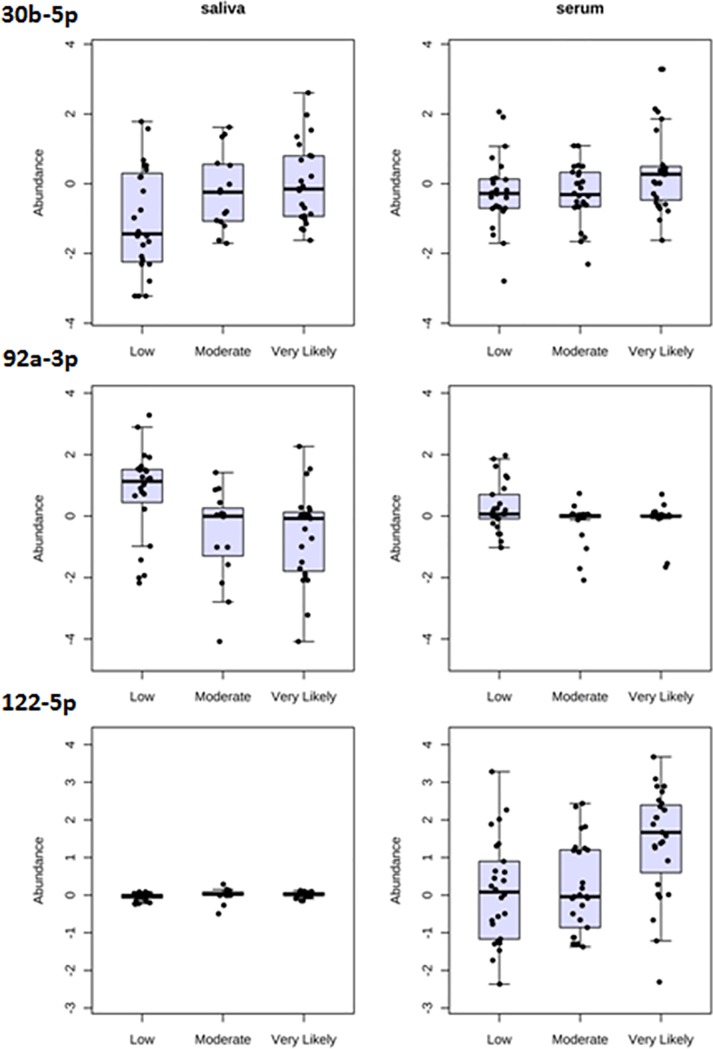
Fig 8. Changes in miRNA expression levels in saliva and serum post-fight, binned according to HTH levels /mTBI likelihood.
Data displayed are whisker-box plots. Each row represents a different miRNA (three miRNAs are shown), and each dot represents the expression level of that miRNA in a sample. Note that some miRNAs showed a pattern of increase in both biofluids post-fight (30b-5p, top), while others showed a change that was most evident in only a single biofluid type (e.g., 92a-3p and 122-5p).

