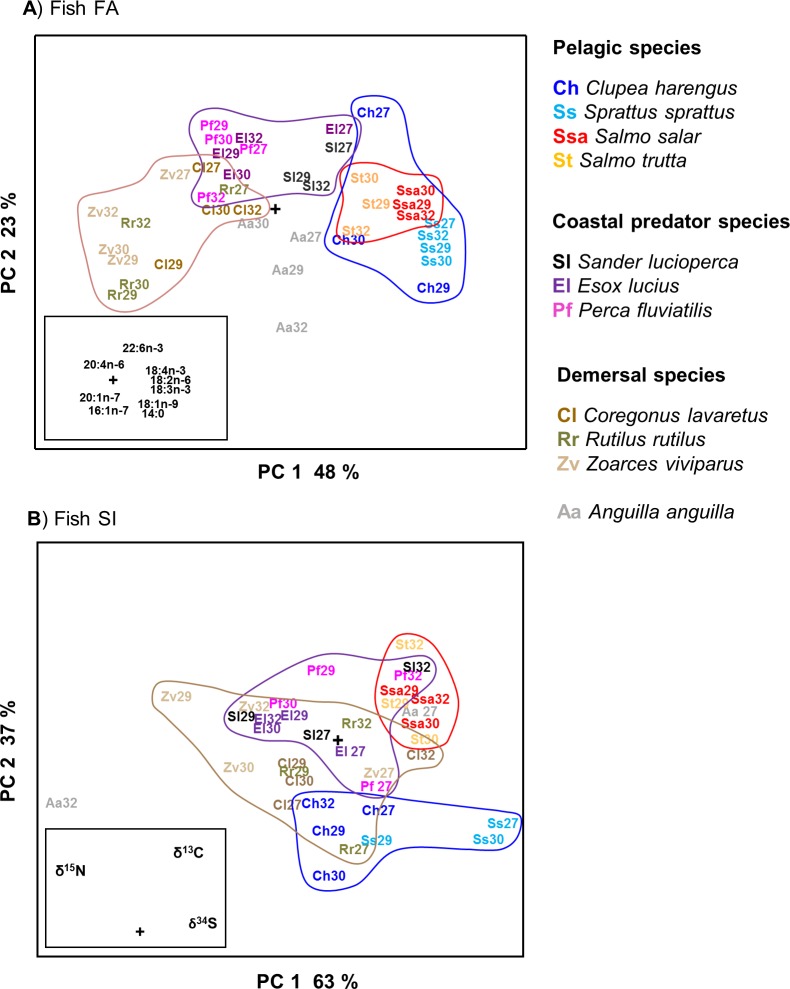
Fig 2.
PCA scores plots of A) FA and B) SI means for the 11 key prey fish species from ICES-subdivisions 27, 29, 30 and 32. The species and their habitat classification are shown on the right. Target sample number per species for each area was 6 specimens (Table A in S1 Table). Loadings plots of the variables were added as inserts. Paired SIMCA tests (P < 0.05) of the statistical significance of the compositional differences between and within species are presented in supporting information (Tables B-C and Text B in S1 Table).

