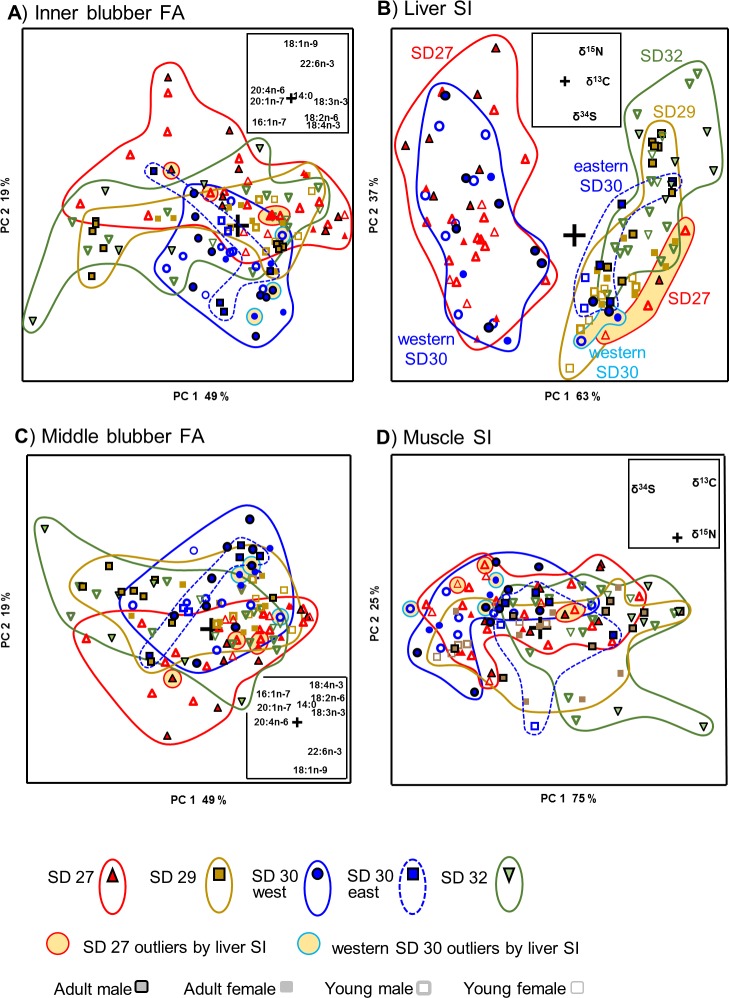
Fig 3.
PCA scores plots of the mid-term markers A) inner blubber FA, B) liver SI, and the long-term markers C) middle blubber FA and D) muscle SI data for grey seal individuals (n = 108) collected from ICES-subdivisions 27, 29, 30 and 32. Symbol key is presented below figures. Loadings plots of the variables were added as inserts. Without any subgrouping of the individuals, according to age or sex, the paired SIMCA tests (P < 0.05) showed no significances in any comparisons between ICES areas.

