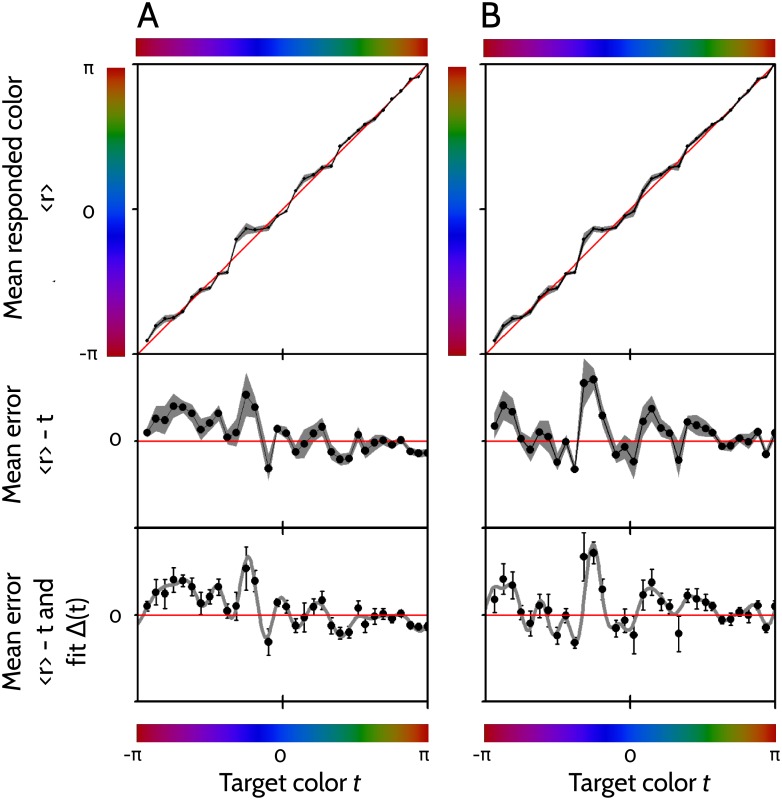
Fig 4. Characterization of the responses.
Panels A and B correspond to two example players. Top: Black line: Mean response as a function of the target color t. Gray area: Range of values in . Middle: Mean error (black line), together with expected error of the mean (gray area). Bottom: Fitted curve Δ(t), together with the experimental data (black dots) and the expected error of the mean (error bars). In the middle and bottom panels, the vertical scale spans from −π/6 to + π/6.

