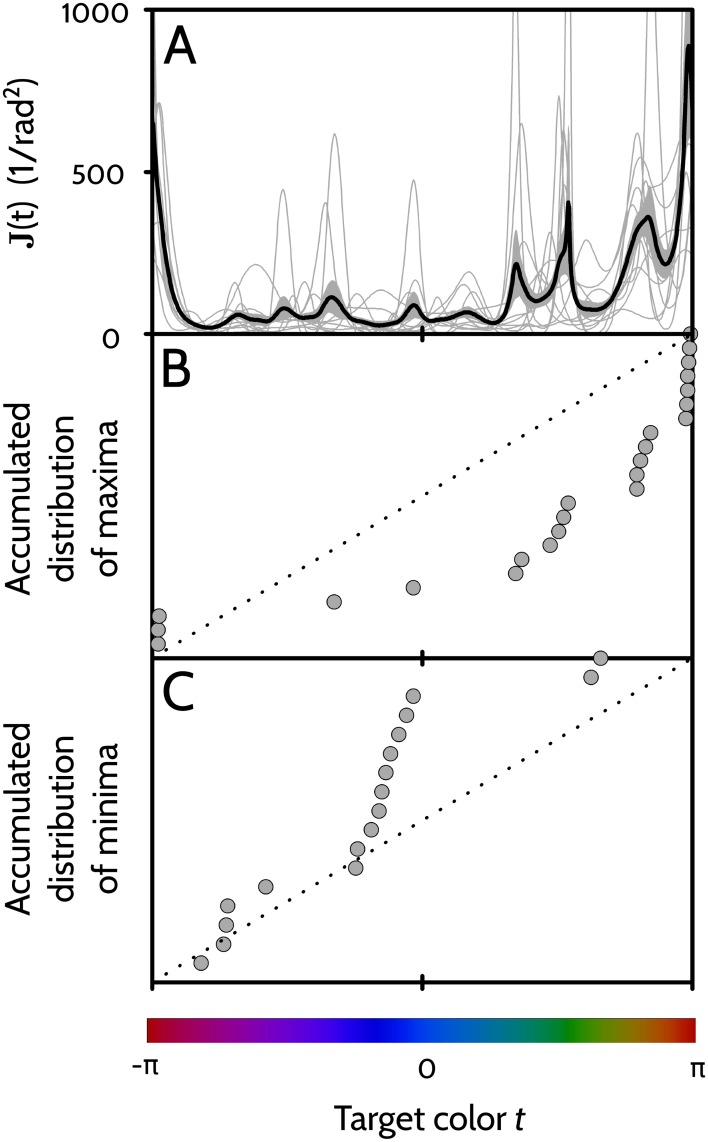
Fig 7. Amount of Fisher information along the locus of sampled colors.
A: Thick line: Sample average of the amount of Fisher information obtained by the individual players. Gray area: Region of values contained in 〈J(t)〉 ± standard error of the sample mean. Thin lines: individual curves J(t) for each of the 11 players. B: Data points: Empirical cumulative distribution function of the set of relevant maxima of J(t) obtained from the 11 players. Dotted line: Accumulated distribution expected for a process with uniform probability density. C: Data points: Empirical cumulative distribution function of the set of relevant maxima of 1/J(t) obtained from the 11 players. Dotted line: Same as in B. In B and C, the vertical axis extends from 0 to 1.

