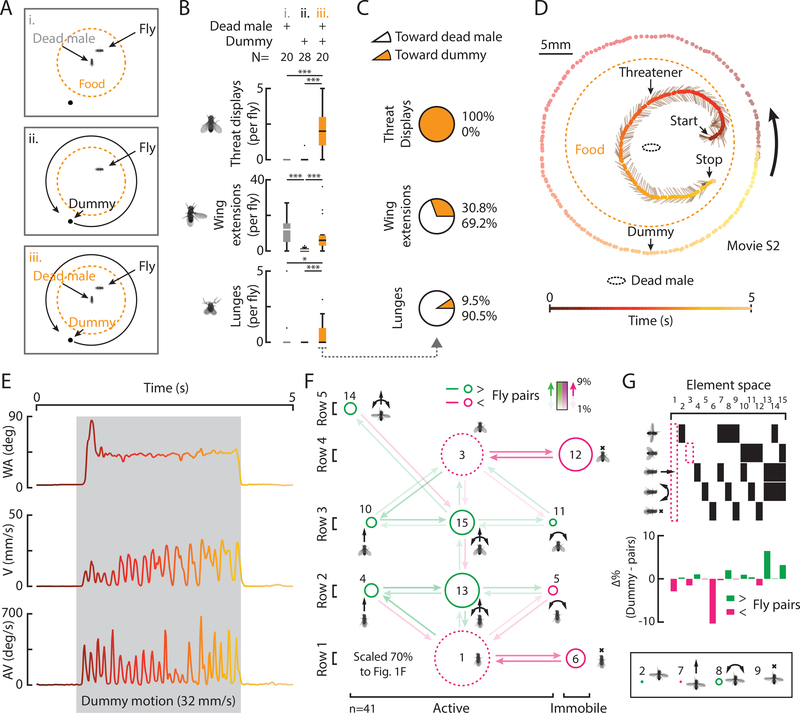
Figure 2: Chemosensory cues plus a moving object suffice to evoke threats.
A) Experimental conditions. B) Total behaviors per fly evoked in conditions indicated. (Pairwise and multiple comparison tests; *=p<0.05; **=p<0.01; ***=p<0.001 throughout) C) The percent of behaviors directed toward the dead male or the dummy in condition iii. D) A trajectory shows a threatener in relation to a dead male, a dummy, food, and time. E) WA, V, and AV from D, color coded to time. F) A transition diagram for all threats (condition iii, n=41). G) The relative differences in element space from threats by WT pairs (Fig. 1Eii) where green indicates increases and magenta, decreases.

