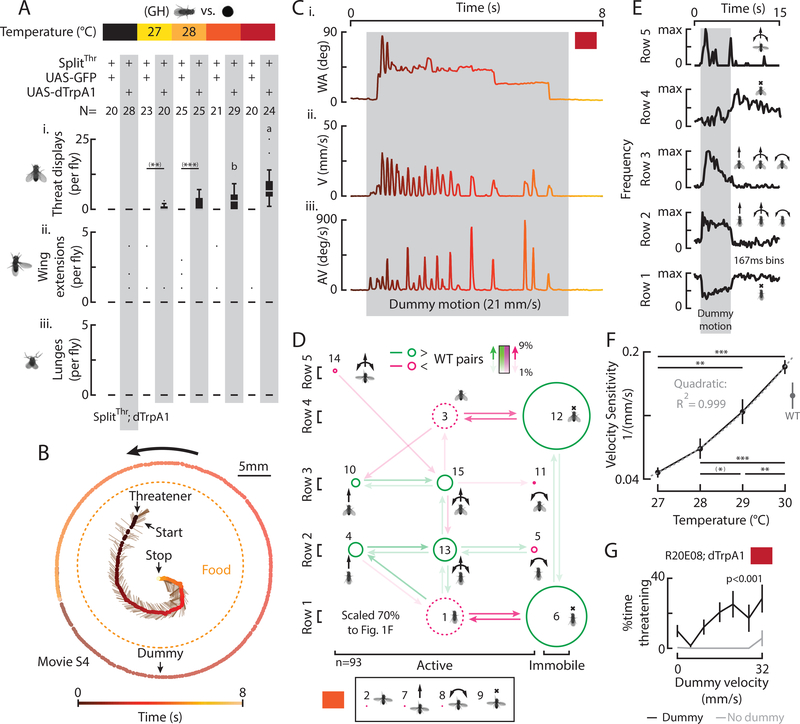
Figure 4: Thermogenetic activation of solitary SplitThr flies substitutes for male cues and enhances sensitivity to dummy motion.
A) Total behaviors per fly (i-iii), according to genotype and temperature, in the presence of a moving dummy. ((*) indicates pairwise significance that did not survive multiple comparison tests throughout). B) A trajectory shows an induced threatener in relation to a moving dummy, food, and time. C) WA (i), V (ii), and AV (iii) for B, color coded to time. D) A transition diagram for all threats expressed in the presence of a dummy (n=93, 29°). E) The frequency of row specific elements in time, aligned to dummy motion (Fig. S5A, orange). F) Mean velocity sensitivity (1/ minimum dummy velocity evoking a threat ±SEM) vs. temperature with WT data from Fig. S2Biii. G) Mean percent of time ±SEM R20E08 activated flies expressed threats with (black) and without (gray) a dummy. (p-value from one-way ANOVA).

