

Abstract
Genetic variants identified in genome-wide association studies of educational attainment have been linked with a range of positive life course development outcomes. However, it remains unclear whether school environments may moderate these genetic associations. We analyze data from two biosocial surveys that contain both genetic data and follow students from secondary school through mid- to late life. We test if the magnitudes of the associations with educational and occupational attainments varied across the secondary schools that participants attended or with characteristics of those schools. Although we find little evidence that genetic associations with educational and occupational attainment varied across schools or with school characteristics, genetic associations with any postsecondary education and college completion were moderated by school-level socioeconomic status. Along similar lines, we observe substantial between-school variation in the average level of educational attainment students achieved for a fixed genotype. These findings emphasize the importance of social context in the interpretation of genetic associations. Specifically, our results suggest that though existing measures of individual genetic endowment have a linear relationship with years of schooling that is relatively consistent across school environments, school context is crucial in connecting an individual’s genotype to his or her likelihood of crossing meaningful educational thresholds.
Keywords: polygenic score, educational attainment, GxE, schools
EDUCATIONAL outcomes are “heritable”; they tend to be more similar among more genetically similar individuals (for example, siblings as compared to cousins; Branigan, McCallum, and Freese 2013; Polderman et al. 2015). Recently, genome-wide association study (GWAS) designs have been used to identify molecular genetic correlates of educational attainment (Lee et al. forthcoming; Okbay et al. 2016; Rietveld et al. 2013). GWAS results can then be used as a scoring algorithm to construct a polygenic score (PGS), a summary measurement quantifying genome-wide genetic influence on some target phenotype (Dudbridge 2013). Critically, unlike heritability, a PGS is an individual-level measurement that can be calculated for a person from his or her DNA, allowing social scientists to integrate genetics into standard biosocial models of behavior. A polygenic score constructed based on results from a recent educational attainment GWAS explains more than 10 percent of observed variation in educational attainment (Lee et al. forthcoming) and has been replicated in multiple samples spanning several continents (Belsky et al. 2016; Okbay et al. 2016; Rietveld et al. 2013, 2014). Further, within-sibling analyses, which use family fixed effects to isolate the effects of genetic differences from the effects of environmental differences, suggest that the educational attainment PGS does so largely by indexing genetic differences that play causal roles (Belsky et al. 2018; Domingue et al. 2015).
Although there is substantial evidence linking the educational attainment PGS directly to educational attainment, we are only beginning to understand how this relationship is situated within broader educational attainment processes. Educational attainments vary substantially across schools, and there is evidence that some of this variation reflects the causal effects of school characteristics on students’ educational outcomes (Chetty et al. 2011; Chetty, Friedman, and Rockoff 2011). Yet, we know little about the degree to which genetic influences on educational and occupational attainment may be moderated by such environmental forces. For example, some analyses of heritability suggest that genetic differences may be more influential in higher-socioeconomic status (SES) environments (Tucker-Drob and Bates 2015; Turkheimer et al. 2003). However, not all evidence suggests the same conclusion (Figlio et al. 2017). Given the heterogeneity across school environments in the United States, understanding the degree to which there is interplay between one’s educational environment and genotype will inform our interpretation of predictions using the educational attainment PGS.
Educational attainment is a critically important social outcome, but it is an incomplete characterization of social position (Mood 2017); other life course attainments are also relevant. In particular, occupation is key to understanding processes of social attainment (Jonsson et al. 2009). Although the GWAS results we study here were trained to predict educational attainment, they also predict a broader set of socioeconomic attainments net of educational attainment, including occupational attainment (Belsky et al. 2016; Papageorge and Thom 2016). Thus, we additionally consider heterogeneity in the association between individual genotype and educational environment when predicting occupational attainment. We also consider the moderation of the relationship between an individual’s polygenic score and his or her probability of crossing specific educational thresholds (i.e., credentialing). We specifically focus on enrollment in and completion of postsecondary education.
To explore how the relationship between genotype and educational attainment may vary across contexts, we use data from two biosocial longitudinal studies that followed students from secondary school through mid- to late life. We test for school-level moderation of the association between the educational attainment PGS and both educational and occupational attainments. To contextualize findings, we conduct parallel analyses of two established predictors of educational attainment: family socioeconomic status and cognitive ability. Our analyses suggest that, although the educational attainment PGS is a robust predictor of individual outcomes, school-level environmental moderation of the educational attainment PGS’s association with educational and occupational attainments is likely to be small. Nonetheless, the probability that a person with a given value regarding his or her educational attainment PGS will make important educational transitions (to postsecondary education and subsequent college completion) is moderated by school-level factors, such as school socioeconomic status. However, this moderation is driven by changes in the expected outcome for a given PGS across social contexts (i.e., horizontal shifts in the distribution) and is not due to a change in the linear association between the PGS and outcome across context. These findings replicate across multiple data sets and methodologies.
School-Level Moderation of Genetic Effects
A gene-environment interaction (GxE) is the existence of heterogeneous genetic effects across different environmental conditions. Knowledge of GxE is important for interpreting genetic effects; when GxE exists, efforts to explore how genotype influences phenotype must be contextualized. As the intersection of individual-level differences and group-level social structures and processes, questions regarding GxE attract substantial interest from social scientists studying the genetic influences of social outcomes.
In the following section, we discuss our framework for studying GxE. Before doing so, we discuss two methodological challenges relevant to such a pursuit. One challenge that has historically plagued the GxE literature is a lack of statistical power (Culverhouse et al. 2017; Duncan and Keller 2011). Our study uses polygenic score methods to combine information from education-linked genetic loci across the genome, yielding a relatively strong genetic predictor. A second challenge is the potential endogeneity of environmental exposures to genotypes (Fletcher and Conley 2013). Such endogeneity may arise from gene-environment correlations (rGEs), in which environmental exposures are associated with one’s genotype (Kendler and Baker 2007; Krapohl et al. 2017; Plomin and Bergeman 1991). As a consequence, we limit our inquiry to the investigation of the potential moderation of the statistical association between genotype and attainment outcomes, leaving any causal claims for future research.
Our Framework for Examining GxE
Previous GxE work has a poor replication record (Duncan and Keller 2011; Young-Wolff, Enoch, and Prescott 2011), which has led to skepticism about this line of inquiry (Eaves 2006; Munafò and Flint 2009). Further, as the focal estimand is typically an interaction term, results from GxE studies are known to be sensitive to model specification decisions (Keller 2014; Tchetgen and Kraft 2011). Given these previous problems, we attempt to be precise about the specific data-generating mechanisms we envision giving rise to GxE (see Section A of the online supplement) as well as our power for identifying GxE under different scenarios.
The primary challenge is that we lack knowledge of which, if any, school-level environmental variables may be moderating the relationship between the PGS and educational attainment. To circumvent this problem, we first consider an “indirect” model of GxE, wherein we only examine variation in the correlation between the outcome and PGS across schools (remaining agnostic about the specific environment that may be driving this variation). We then conduct specific tests of GxE based on two candidate environmental variables that have been shown to be of interest in previous work (which we discuss in the next section).
School Environments and GxE
The effects of schools on student attainments are a core interest of educational research. Studies dating back to at least the Coleman report (1968) document how school characteristics influence students’ future educational, social, and economic outcomes (Barnard 2004; Fonagy et al. 2005; Fuller and Clarke 1994). For example, school SES is a reliable correlate of student attainments (Perry and McConney 2010). GxE, however, requires the identification of subtler environmental influences (Boardman, Daw, and Freese 2013). In the traditional study of GxE, the key question is not which environments influence student attainments (we have knowledge of numerous environments that do so). Rather, the challenge has been to identify environments that restructure the relationship between genotype and educational attainment.
It is not immediately obvious which measurable school-level features may moderate the association between genotype and educational attainment in this way. Moreover, many measurable school environments may simultaneously contribute to moderation; for example, theoretical literature suggests that the effects of the genome on life course attainments may depend on both resource inequality and social mobility (Adkins and Vaisey 2009). We address this uncertainty by first studying variation in school-level associations between the educational attainment PGS and outcomes (i.e., equation 2 in the online supplement). Such an approach is agnostic as to which of the many school-level environments may matter and is analogous to school effect research that focuses on the existence of school-level variation in outcomes (Raudenbush and Willms 1995) rather than variation due to an identifiable school-level environment. In some circumstances, this strategy may have reduced statistical power. Thus, we also conduct tests related to two candidate environmental moderators (i.e., equation 3 in the online supplement).
The first candidate environment that we test is an overall measure of school socioeconomic status based on parents’ education. It has long been known that school SES is highly correlated with other indicators of overall school quality (Baker, Goesling, and LeTendre 2002; Hoover-Dempsey, Bassler, and Brissie 1987). We anticipate that this environmental measure will be strongly associated with both educational and occupational attainments of respondents, but it is not clear a priori that we should expect school SES to moderate the returns to an individual’s education-related genotype. The second candidate environment is a measure of school stratification. We consider a measure of inequality in parents’ education, hypothesizing that schools with high levels of inequality in parental education may be more rigidly stratified (e.g., may be more likely to “track” students). In earlier work (Boardman, Domingue, and Fletcher 2012), this school environment appeared to moderate the degree to which friends were genetically similar. Although not exhaustive of all environments that one might wish to measure at the school level, these candidate environments are reflective of the types of environments one might use in GxE studies.
Methods
Data
We deploy two data sets in studying whether schools moderate the influence of the educational attainment PGS: The Wisconsin Longitudinal Study (WLS) (Herd, Carr, and Roan 2014) and The National Longitudinal Study of Adolescent to Adult Heath (Add Health) (Harris 2013; Harris et al. 2013). Following the assay of biospecimens, genome-wide data are available for approximately 9,100 WLS members and for approximately 9,500 Add Health members. PGS analysis in diverse samples is currently not feasible (Martin et al. 2017), so we focus on subsamples of respondents of European ancestry given that such samples were the training data in the original GWAS. There exists a paucity of longitudinal data sources that have both molecular genetic data and clusters of respondents in common schools. We use the innovative approach of combining the WLS (N = 8,494) and Add Health (N = 4,915) to study the interaction of school environments and individual genotypes. Additional details on these data are available in Section B1 of the online supplement.
Measures
We briefly describe the key measures used in this study here. Additional details on their construction and characteristics are included in Section B2 of the online supplement.
Outcomes.
Given that the educational attainment PGS is associated with a variety of life course attainments (Belsky et al. 2016; Papageorge and Thom 2016), we consider the outcomes related to time in school and job status. We consider educational attainment, which is measured as the years of completed education when the Add Health respondents were aged 24 to 32 and the WLS respondents were in their mid-40s. We also consider indicators of whether they engaged in any postsecondary schooling (>12 years of education) and were college graduates (≥16 years of education). Finally, we consider a measure of job status (Hauser and Warren 1997) based on jobs reported by respondents in 2008 for Add Health and 1992 for the WLS.
Predictors.
We focus primarily on a polygenic score constructed to predict educational attainment based on the most recently available GWAS for this phenotype (Lee et al. forthcoming). Alongside the educational attainment PGS, we examine household socioeconomic status and early-life cognitive functioning as additional individual-level measures related to life course attainments. We use results from these analyses as benchmarks for evaluating the magnitude of the relationships observed with the PGS.
Candidate environments.
We consider two candidate school environments. The first, the mean percentage of mothers with at least a high school diploma, is meant to represent school status. The second, the Gini coefficient in reported levels of parental education, is meant to represent school stratification. In both data sets, we construct these measures for those schools with at least 10 students for whom we have data. We interpret our measures as noisy proxies for the true environments of interest and explore the consequences of this possible measurement error in our power analysis.
Analysis
As discussed in the section on school environments and GxE, we first examine the possibility of school-level GxE using an approach that is agnostic as to which specific feature of the environment may be relevant. We do this via the estimation of a random effects model; in particular, we examine a model of the form (where individual i is in school j):
| (1) |
We additionally assume that (μj, δj) ~ multivariate normal[0,Ω]. The focal parameter here will be the variation in δj as captured by estimates of the covariance matrix Ω (i.e., ). To the extent that estimates of this quantity are near zero, this suggests that the effect of the PGS is relatively constant across all schools observed in our data. We also consider a modified version of equation 1 wherein we first mean center years of education (or other outcomes) in each school and thus do not include the random intercept term μj. In all analyses, the focal predictors and outcomes are standardized, and we include sex and birth year as covariates. For the WLS, we also include a family-specific random effect to account for sibling relatedness.
Evaluations of nearness to zero as they pertain to estimates of variance components, such as , need to be made carefully. To aid our interpretations of estimates of equation 1, we rely upon a variation of a Fisher exact test (Athey and Imbens 2017) wherein respondents are randomly assigned to the set of schools in the data (i.e., we ignore actual school assignment). A Fisher exact test is a form of randomization inference that involves comparing an observed distribution of outcomes to many simulated distributions under a null hypothesis; here, the null hypothesis is that there is no school-level moderation of the educational attainment PGS. Utilizing such a test allows for the detection of statistically significant variation of association between the PGS and educational attainment at the school level. We evaluate the magnitude of our observed relative to the distribution of simulated . Specifically, we focus on the quantile rank of elements of relative to the distribution of after repeated randomizations. We examine one minus the mean quantile rank, which we treat as a p value for the implied randomization test.
We then turn to analyses that focus on two candidate environments: school status and school stratification. For analyses based on the these candidate school environments Ej, we estimate the following:
| (2) |
Note that we allow differences in mean school outcomes via the inclusion of the random effect uj. Interest resides in estimates of β3. To guard against spurious findings of GxE (Keller 2014), the X′ β term also includes interactions between the key predictors (PGSij and Ej) and other control variables (sex and birth year).
Results
Gene–Environment Correlation
The school a child attends is not independent of genotype; subsequent findings will need to be interpreted in light of this selection process. Specifically, 6.5 percent of the variation in the educational attainment PGS is between schools in Add Health compared to 2.1 percent in the WLS (see Table S1 in online supplement). These findings are consistent with those previously observed between school types in the United Kingdom (Smith-Woolley et al. 2018). However, the educational attainment PGS is clustered within schools to a much lesser degree than other individual-level predictors. Approximately 17 to 27 percent of the household SES and 7 to 10 percent of the cognitive functioning variation is between schools. One consequence of this clustering is that we observe an association between the school-mean educational attainment PGS and school status. Figure 1 shows the school-mean educational attainment PGS as a function of our environmental measure related to school status (i.e., the proportion of mothers who finish high school in the school). In Add Health, these figures are highly correlated (r = 0.52), but even in the WLS, there is an observable gradient (r = 0.12). To address this potential source of bias, we focus interpretation on a model in which the outcome is school centered in our indirect GxE analyses.
Figure 1:
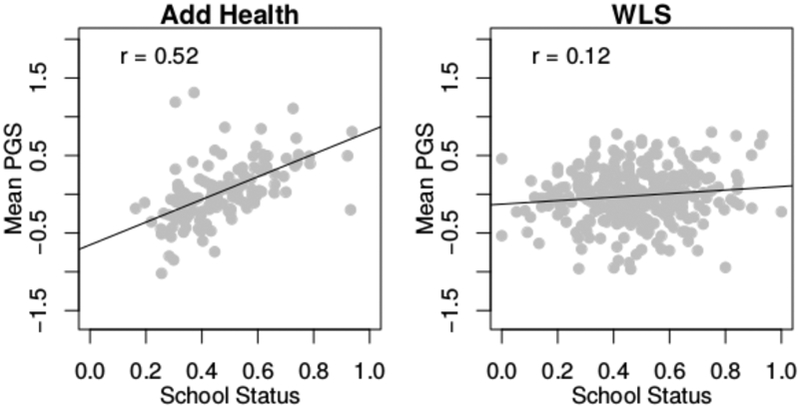
Mean PGS for the respondent as a function of school status (percent of parents with a high school diploma) in each data set. PGS, polygenic score; WLS, Wisconsin Longitudinal Study.
Power Analysis
Power curves for the detection of a single environmental moderator are shown in Figure 2 (see details in Section C of the online supplement). If we observe the environmental moderator without error (black line), then we have sufficient power to detect interactions using the direct approach when the interaction coefficient is approximately one-fifth the size of the main genetic effect (power of 0.8 is obtained when interaction coefficients are around 0.04 in Add Health and 0.03 in the WLS). Note that these correspond to small amounts of additional explained variance; observed r2 values are less than 0.005 (see top panels in Figure 2). Our indirect approach (red line) has less power; we can only detect interactions that are roughly twice as large as in the direct approach. We also consider power based on noisy observations of the environmental moderator; here, direct analysis based on an environmental moderator measured with a great deal of noise (e.g., α = 0.4) still offers superior power to the indirect approach in the WLS but not in Add Health.
Figure 2:

Power analysis based on 10,000 random GxE coefficients (b3; x axis) and specified main effect values (b1 = genetic main effect; b2 = environment main effect). WLS, Wisconsin Longitudinal Study.
Evidence from Indirect Analyses
Educational attainment.
Focusing first on the models with random intercepts, increases in the educational attainment PGS are associated with additional educational attainment (in standardized units, b = 0.31 in Add Health and b = 0.24 in the WLS [see left half of Table 1]; in raw years of educational attainment, 0.67 years in Add Health and 0.55 years in the WLS). The estimated SD of slopes, , is 0.033 in Add Health and 0.060 in the WLS. Illustrations of this type of variation can be found in Figure 3; the increased variation in slopes in the WLS relative to Add Health is apparent. In particular, note that there is a concentration of all trajectories around 12 years of schooling in the WLS. As we discuss later, this is largely because most of the respondents in the WLS had to complete 12 years of education to be eligible for the study.
Table 1:
Comparison of estimated variance components from equation 1 (indirect approach) to those based on randomization analysis (as well as estimated coefficients for individual predictors). Results for polygenic score analyses are in bold. Randomization p values (italicized, along with SDs of slopes) are based on 1,000 random assignments of students to schools.
| Models with Random Intercept | Models with Mean Centering | ||||||||||
|---|---|---|---|---|---|---|---|---|---|---|---|
| Outcome | Predictor | SE | PV | PV | SE | PV | |||||
| Add Health | |||||||||||
| Education | PGS | 0.312 | 0.013 | 0.323 | 0.000 | 0.033 | 0.199 | 0.275 | 0.014 | 0.057 | 0.060 |
| Education | SES | 0.422 | 0.017 | 0.209 | 0.000 | 0.095 | 0.004 | 0.293 | 0.018 | 0.131 | 0.000 |
| Education | COG | 0.324 | 0.017 | 0.316 | 0.000 | 0.107 | 0.000 | 0.270 | 0.017 | 0.113 | 0.000 |
| Any Postsecondary | PGS | 0.098 | 0.006 | 0.107 | 0.000 | 0.027 | 0.083 | 0.082 | 0.006 | 0.018 | 0.174 |
| Any Postsecondary | SES | 0.138 | 0.007 | 0.063 | 0.000 | 0.033 | 0.086 | 0.091 | 0.007 | 0.033 | 0.017 |
| Any Postsecondary | COG | 0.111 | 0.008 | 0.101 | 0.000 | 0.060 | 0.000 | 0.090 | 0.008 | 0.053 | 0.000 |
| College Completion | PGS | 0.134 | 0.007 | 0.133 | 0.000 | 0.035 | 0.003 | 0.117 | 0.007 | 0.026 | 0.021 |
| College Completion | SES | 0.193 | 0.009 | 0.000 | 0.732 | 0.063 | 0.000 | 0.122 | 0.008 | 0.054 | 0.000 |
| College Completion | COG | 0.122 | 0.008 | 0.136 | 0.000 | 0.039 | 0.005 | 0.100 | 0.008 | 0.047 | 0.000 |
| Occupation | PGS | 0.219 | 0.015 | 0.216 | 0.000 | 0.048 | 0.123 | 0.182 | 0.014 | 0.042 | 0.161 |
| Occupation | SES | 0.330 | 0.015 | 0.000 | 0.667 | 0.054 | 0.082 | 0.209 | 0.016 | 0.077 | 0.000 |
| Occupation | COG | 0.236 | 0.014 | 0.213 | 0.000 | 0.008 | 0.620 | 0.194 | 0.014 | 0.021 | 0.314 |
| WLS | |||||||||||
| Education | PGS | 0.236 | 0.011 | 0.211 | 0.000 | 0.060 | 0.048 | 0.221 | 0.011 | 0.034 | 0.042 |
| Education | SES | 0.373 | 0.012 | 0.114 | 0.000 | 0.050 | 0.080 | 0.262 | 0.014 | 0.097 | 0.000 |
| Education | COG | 0.407 | 0.012 | 0.184 | 0.000 | 0.091 | 0.004 | 0.358 | 0.012 | 0.080 | 0.000 |
| Any Postsecondary | PGS | 0.103 | 0.005 | 0.109 | 0.000 | 0.016 | 0.051 | 0.096 | 0.006 | 0.020 | 0.021 |
| Any Postsecondary | SES | 0.182 | 0.005 | 0.056 | 0.000 | 0.002 | 0.418 | 0.129 | 0.007 | 0.042 | 0.000 |
| Any Postsecondary | COG | 0.192 | 0.005 | 0.091 | 0.000 | 0.018 | 0.001 | 0.167 | 0.006 | 0.037 | 0.000 |
| College Completion | PGS | 0.102 | 0.005 | 0.089 | 0.000 | 0.029 | 0.043 | 0.100 | 0.005 | 0.000 | 0.274 |
| College Completion | SES | 0.156 | 0.006 | 0.055 | 0.000 | 0.028 | 0.185 | 0.114 | 0.006 | 0.034 | 0.002 |
| College Completion | COG | 0.177 | 0.006 | 0.074 | 0.000 | 0.038 | 0.015 | 0.156 | 0.005 | 0.025 | 0.000 |
| Occupation | PGS | 0.142 | 0.013 | 0.200 | 0.000 | 0.035 | 0.139 | 0.130 | 0.012 | 0.034 | 0.097 |
| Occupation | SES | 0.269 | 0.012 | 0.109 | 0.001 | 0.034 | 0.173 | 0.178 | 0.013 | 0.050 | 0.000 |
| Occupation | COG | 0.354 | 0.011 | 0.127 | 0.000 | 0.007 | 0.531 | 0.304 | 0.011 | 0.013 | 0.176 |
Note: COG, cognition; PGS, polygenic score; PV, p value ; SES, socioeconomic status; WLS, Wisconsin Longitudinal Study.
Figure 3:

Prototypical plots for outcomes as a function of educational attainment PGS (for those schools with at least 10 respondents). Each line represents a school-level association between the PGS and the relevant outcome. Thick, red lines show the schools with slopes in the top and/or bottom 5 percent of the distribution of slopes in each panel. PGS, polygenic score; WLS, Wisconsin Longitudinal Study.
In Add Health, the magnitudes of the variance components related to the educational attainment PGS are largely consistent with estimates derived from randomization analyses in which there is no school-level moderation of the PGS’s effect (p = 0.199; see Table 1). In the WLS, there is some weak initial evidence for moderation (p = 0.048). However, we interpret this result cautiously. There is a strong estimated correlation () between the slopes and intercepts, suggesting that the effect of the PGS on educational attainment is highest in schools with the highest average levels of educational attainment. In contrast to what we observe with respect to variation in the slopes, we observe large variation in the intercepts, as measured by , in both data sets. All data sets with students randomly assigned to schools produce much smaller variation in the intercepts than what is estimated in either empirical data set; we elaborate on this point below.
To further examine the implications of the strong correlation between random slopes and intercepts, we estimate a version of equation 1 that does not include random intercepts using data for which the outcome is centered within the school. Estimates of the effect of the PGS are similar to those noted above (b = 0.28 in Add Health and b = 0.22 in the WLS; see right half of Table 1 as well as Table S2 in the online supplement). The estimated variation in slopes, , is now larger in Add Health than in the WLS. In both data sets, we observe randomization p values associated with this quantity around 0.05 (p = 0.06 in Add Health; p = 0.04 in the WLS).
We also examine variation in associations between our two outcomes related to academic thresholds—any postsecondary education and college completion—and the educational attainment PGS. For Add Health, there is more variation in the association between the educational attainment PGS and college completion than in the randomization data sets (p = 0.02 in the mean-centered analysis). In contrast, for the WLS, there is more variation in the slopes for the any-postsecondary analysis (p = 0.02 in the mean-centered analysis).
Job status.
The educational attainment PGS is robustly associated with job status in both data sets (see Table 1). Note that the distributions of job status (see Figure S1 in the online supplement) are more approximately normal than the distributions for educational attainment. In comparison to the educational attainment results in Add Health (where all the lines in Figure 3 are relatively parallel), there is potentially more variation in the association between the educational attainment PGS and job status. However, focusing on the mean-centered analyses, there is no evidence for a substantial difference in association between the PGS and job status across schools in either the Add Health (p = 0.16) or the WLS (p = 0.10).
Alternative predictors.
To better contextualize our findings related to the educational attainment PGS, we also consider results based on replacing the educational attainment PGS with either a measure of cognition or childhood socioeconomic status. As expected, these quantities are strong predictors of both attainment measures: educational achievement and job status (see Table S1 in the online supplement; note that the educational attainment PGS correlates with educational attainment at 0.26–0.36, whereas the other predictors show correlations with educational attainment above 0.37). In contrast to the results based on the educational attainment PGS, there is strong evidence for school-level moderation of both the SES and cognition link to educational attainment in both data sets (Table 1). There is also evidence of school-level moderation of the association between household SES and occupational returns. Note both the strength and consistency of these findings. In comparison to these findings, the previously discussed evidence for the moderation of genetic effects is relatively weak.
Variation in returns.
An obvious implication of the results described in Table 1 pertains to the substantial variation in returns to a given genotype as a function of school assignment (i.e., the variation in intercepts, ). There is far more variation in the intercepts in our empirical data than in the data sets in which the school is randomly assigned. Figure 4 illustrates this fact by showing the distribution of predicted years of educational attainment across schools for three different values of the PGS. Consider the results in Add Health. For the mean PGS (the green distribution), there is more than two years of variation in the expected educational attainment of genetically similar respondents as a function of attending different schools. Students with the mean educational attainment PGS would be expected to get around 13 years of schooling if they attend some schools and 15 or more years of schooling if they attend other schools. The difference is pronounced and consistent with previous reports of substantial differences in school quality and educational opportunity (Card and Krueger 1992). Irrespective of students’ genotypes, the school environment is strongly associated with how far a student will go in school. Results in the WLS are slightly different. At the low end of the PGS distribution, we see relatively tight clustering around 12 to 13 years of schooling. At the high end, however, there is increased variation in the potential outcomes.
Figure 4:

Distribution of predicted years of education across schools for fixed values of the educational attainment polygenic score (PGS). WLS, Wisconsin Longitudinal Study.
Direct Analyses
Evidence is mixed regarding the school-level environmental moderation of the association between the PGS and educational attainment by school status and stratification (Table 2). In Add Health, the gradient between years of schooling and the educational attainment PGS is steeper in more stratified schools. In contrast, in the WLS, this gradient is steeper in higher-status schools (Figure 5; note that results in these figures are not based on a standardized outcome so as to aid interpretation). We interpret these results as weak signals of school moderation for several reasons. First, findings do not replicate across data sets. This may be due to structural changes (i.e., period-related differences in schools) that exist between the educational systems encountered by the WLS respondents as compared to the Add Health respondents (we also explore the role of the inclusion of graduate and sibling respondents in the WLS; see Section D of the online supplement). Furthermore, findings regarding the moderation of associations between the educational attainment PGS and educational attainment do not translate into moderations of associations between the educational attainment PGS and downstream occupational attainments. Finally, these results are not robustly foreshadowed by the indirect analyses in the section of the same title.
Table 2:
Estimated GxE coefficients from equation 2 (direct approach) based on candidate environments (outcome and key predictors are standardized in all analyses).
| Add Health | WLS | |||||||
|---|---|---|---|---|---|---|---|---|
| Outcome | Individual | Environment | β3 | SE | PV | β3 | SE | PV |
| Education | PGS | Status | −0.008 | 0.013 | 0.523 | 0.041 | 0.011 | 0.000 |
| Education | PGS | Stratification | 0.030 | 0.013 | 0.019 | −0.009 | 0.011 | 0.407 |
| Any Postsecondary | PGS | Status | −0.056 | 0.014 | 0.000 | 0.034 | 0.011 | 0.002 |
| Any Postsecondary | PGS | Stratification | 0.043 | 0.014 | 0.001 | −0.006 | 0.011 | 0.590 |
| College Completion | PGS | Status | 0.031 | 0.013 | 0.019 | 0.040 | 0.011 | 0.000 |
| College Completion | PGS | Stratification | 0.002 | 0.013 | 0.867 | −0.008 | 0.011 | 0.468 |
| Occupation | PGS | Status | −0.004 | 0.014 | 0.753 | 0.017 | 0.012 | 0.141 |
| Occupation | PGS | Stratification | 0.005 | 0.013 | 0.684 | −0.003 | 0.012 | 0.801 |
| Education | SES | Status | 0.023 | 0.014 | 0.111 | 0.016 | 0.010 | 0.103 |
| Education | SES | Stratification | −0.006 | 0.015 | 0.665 | −0.002 | 0.011 | 0.861 |
| Any Postsecondary | SES | Status | −0.042 | 0.015 | 0.004 | 0.004 | 0.010 | 0.701 |
| Any Postsecondary | SES | Stratification | 0.023 | 0.015 | 0.122 | 0.005 | 0.011 | 0.643 |
| College Completion | SES | Status | 0.070 | 0.015 | 0.000 | 0.021 | 0.010 | 0.044 |
| College Completion | SES | Stratification | −0.039 | 0.015 | 0.007 | −0.008 | 0.011 | 0.495 |
| Occupation | SES | Status | 0.025 | 0.015 | 0.089 | −0.021 | 0.011 | 0.054 |
| Occupation | SES | Stratification | −0.020 | 0.015 | 0.188 | 0.013 | 0.012 | 0.268 |
| Education | Cognition | Status | −0.044 | 0.014 | 0.002 | 0.037 | 0.010 | 0.000 |
| Education | Cognition | Stratification | 0.031 | 0.014 | 0.030 | −0.002 | 0.010 | 0.807 |
| Any Postsecondary | Cognition | Status | −0.087 | 0.014 | 0.000 | 0.017 | 0.010 | 0.090 |
| Any Postsecondary | Cognition | Stratification | 0.030 | 0.015 | 0.042 | 0.009 | 0.010 | 0.366 |
| College Completion | Cognition | Status | 0.006 | 0.014 | 0.682 | 0.036 | 0.010 | 0.000 |
| College Completion | Cognition | Stratification | 0.011 | 0.015 | 0.440 | 0.000 | 0.010 | 0.982 |
| Occupation | Cognition | Status | −0.023 | 0.015 | 0.111 | −0.008 | 0.011 | 0.467 |
| Occupation | Cognition | Stratification | 0.031 | 0.015 | 0.039 | 0.016 | 0.011 | 0.151 |
Note: PGS, polygenic score; PV, p value; SES, socioeconomic status; WLS, Wisconsin Longitudinal Study.
Figure 5:

Prototypical plots for direct tests of GxE with candidate environments. Environments are at the 25th and 75th percentiles of the school-level distribution. Results are for females of mean age (in the WLS, they are also assumed to be graduate respondents). The right-hand side of each panel shows the distribution of the variable on the y axis. est, estimate; PGS, polygenic score; WLS, Wisconsin Longitudinal Study.
Results based on crossing educational thresholds are more intriguing. We focus on any postsecondary education (more than 12 years of schooling) and the acquisition of a college degree (16 or more years of schooling). As anticipated by Table 1, Table 2 suggests that genetic associations with both postsecondary enrollment and college completion may be moderated by school status. We focus on these results in Figure 6. To enhance the results from linear probability models, we also include panels emphasizing descriptive analysis. In these panels, we show distributions of polygenic scores for those students in the top and bottom quartiles of schools in the respective distributions (for consideration of rGE; note that PGS distributions in high- and low-status schools are more comparable in the WLS than Add Health) as well as a locally weighted scatterplot smoothing (LOESS)-fitted line describing associations between the polygenic score and the probability of either outcome for students in the different schools. These nonlinear trends can then be compared to the linear fits.
Figure 6:

Prototypical plots for direct tests of GxE with candidate environments. Environments are at the 25th and 75th percentiles of the school-level distribution. Results are for females of a mean age (in the WLS, they are also assumed to be graduate respondents). Descriptive panels show distributions (shaded) for students in schools below the 25th percentile and above the 75th percentile (red and blue, respectively). LOESS curves plot fitted probabilities as a function of the PGS for all respondents (black) and those in schools captured in the density plot of same color. est, estimate; PGS, polygenic score; WLS, Wisconsin Longitudinal Study.
School status clearly moderates the probability of postsecondary schooling or college completion in both data sets. Consider first enrollment in postsecondary schooling. In the WLS, the interaction is positive. That is, students from higher-status schools were increasingly more likely to enroll in postsecondary education as their PGSs increased. In contrast, the interaction coefficient in Add Health is negative. This is due to the fact that most students in high-status schools from that cohort are already attending some postsecondary school; there is a limited role for genetics to play For both the WLS and Add Health study members, the association between one’s genetics and completing college were more pronounced for students who attended higher-status schools.
Turning to the other predictors (social origin and cognitive functioning), the association of social origin with educational attainment appears to be consistent across these two environments. In contrast, the effect of cognitive functioning on educational attainment seems to be moderated by school status in both data sets. However, this moderation is of an inconsistent sign; further work is perhaps needed to identify whether certain measurable school-level environments are reliable moderators of these individual-level variables.
Discussion
Findings from two longitudinal studies of those born in the United States roughly a half-century apart suggest that school-level moderation of genetic influences on educational attainment—as captured by a PGS constructed using the third-generation GWAS of this outcome (Lee et al. forthcoming)—are likely to be, in general, small. The PGS is a robust predictor of educational and occupational attainments whose predictive power may vary slightly across schools but does not seem to do so as a function of the measured environments we consider here. In contrast, we observe evidence for the school-level moderation of the relationship between individual cognitive functioning or SES and the related set of life course attainments (although it is sometimes unclear which specific school-level environments may lead to such moderation).
A key exception to the results described above is the moderation of the probability of the two binary outcomes related to postsecondary education for a given PGS. Our analyses for both any postsecondary education and college completion showed evidence of moderation by school SES. We observe (Figure 6) that at a time when higher education was less common (Bailey and Dynarski 2011)—that is, when the WLS respondents were young—higher educational attainment PGS–students from higher-status schools were much more likely to attend any postsecondary schooling. In contrast, for those who attended school more recently (i.e., the Add Health respondents), enrollment in any postsecondary schooling was more common and even low-PGS students at high-status schools are likely to be in higher education, resulting in a relatively flat slope for these schools. The inconsistency of sign for the GxE coefficient estimates for postsecondary enrollment is interpretable in light of Figure 4. The amount of education predicted by an individual’s educational attainment PGS varies substantially across the two study periods (an Add Health respondent with a mean PGS would expect to get 14–15 years of schooling, whereas a WLS respondent with a mean PGS would expect closer to 13 years of schooling; see Figure 4). The changing baseline rate of college attendance mechanically alters the relationship between genes and the environment.
This finding emphasizes important differences between these two studies that make generalization challenging. The WLS is a more homogeneous cohort from an earlier historical period wherein students tended to be in school for fewer years overall; more students dropped out of high school, and fewer received postsecondary education (Heckman and LaFontaine 2010). Moreover, WLS respondents were genotyped later in life, so mortality selection may also complicate these findings (Domingue et al. 2017). Finally, respondents in the WLS have a truncated distribution of educational attainment (see Figure S1 in the online supplement), as participants of the WLS had to graduate high school to be eligible to be empaneled (or be a sibling of such a graduate).
There is also the potential for endogeneity that complicates the interpretation of our findings. For example, the mean status of the school that a student attends is correlated with the school’s mean polygenic score (see Figure 1). Similarly, endogeneity also exists with respect to the results focusing on SES and cognitive functioning as these are also associated with school choice and potentially associated with individual genotype. With respect to SES, the childhood socioeconomic environment is associated with both an individual’s genetics (Belsky et al. 2016) as well as the genetics of the parents (Belsky et al. 2018; Conley et al. 2015). Indeed, recent results suggest that parental genetics may have implications for offspring even when not directly transmitted (Kong et al. 2018). Cognitive functioning as measured in either study is almost surely related to the educational environments to which the respondent was exposed up until that point in the life course. In general, genotypes are also not randomly distributed across environments (Domingue et al. 2018a; Domingue et al. 2018b; Haworth et al. 2018), making the interpretation of GxE research challenging.
Despite these limitations, our findings demonstrate several important points. The difference in the distribution of educational attainment across the two data sets highlights an important fact about the interpretation of results from GxE studies. The identification of GxE offers crucial guidance for the interpretation of genetic effects but is not necessarily informative about the underlying cause of the observed GxE. For example, the observed moderation might be due to environmental constraints placed on the variation in phenotype (Tropf et al. 2017) along the lines observed here. On the other hand, we might observe moderation due to the fact that a genetic variant has effects in opposite “directions” across contexts (this issue relates to the distinction between stress-diathesis versus differential susceptibility models; Ellis et al. 2011).
When a genetic variant does, in fact, have effects in opposite directions across contexts, the notion of “genetic risk” is environmentally contingent. However, as we discuss below, results based on polygenic scores are unlikely to capture this type of environmental contingency. Instead, more attention should be paid to how an environment constricts or expands the distribution of the phenotype in question. For example, a constant PGS computed based on a GWAS for body mass index (BMI) predicts a larger BMI for someone born now rather than in the past (Conley et al. 2016; Liu and Guo 2015; Walter et al. 2016). An increase in the PGS for BMI consistently predicts increased BMI; it is just that the BMI distribution has changed over these birth cohorts (Kuczmarski et al. 1994). In rank-order terms, it is certainly not the case that the same genetic profile predicted a relatively slender person (as compared to peers from his or her birth cohort) born in 1950 and a relatively heavy person born in 1990. Such a finding would have profound implications; indeed, it would raise questions about the validity of the results obtained via GWAS.
Rather, our most interesting findings seem to hinge on observable changes in the distribution of the phenotype. Figures 3 and 4 show that there is effectively a floor in educational attainment for WLS participants; nearly all students get at least 12 years of education irrespective of their educational attainment PGS. In contrast, in some schools, the students with a higher educational attainment PGS go on to college, whereas in other schools, they do not. This mechanical constriction of variation at the low end of the attainment ladder may lead to the observed GxE in Table 1 for the PGS’s changing influence on attainment. We favor this structural interpretation given that the variation in association observed with respect to educational attainment does not translate into any such variation in the association with occupational attainment (see also Section D of online supplement). This finding in the WLS is similar to the recent observation that a similar polygenic score predicts additional variance in outcomes in Estonia in the post-Soviet period (Rimfeld et al. 2018) or to the reduction in health disparities linked to genotype after the introduction of a compulsory schooling law (Barcellos, Carvalho, and Turley 2018). These findings all tie reductions in phenotypic variance associated with specific contextual paradigms to reductions in associations with the relevant genetic predictor. Future work of GxE inquiry and interpretation may benefit from careful considerations of how the relevant phenotypic distributions vary across environments before genetic analyses are scrutinized.
Our findings are also worth interpreting in light of recent work discussing differences in academic achievement across school types and the potential role of genetics (Smith-Woolley et al. 2018). They show that differences in the distributions of polygenic scores between nonselective, grammar, and private schools explain some of the difference in academic achievement across the school types. This leads them to the conclusion that differences in the mean academic achievement of the three different school types are due in part to the differences in the underlying genetic composition of their students. However, the extent to which the returns to an individual’s polygenic score vary based on the environmental context is an important consideration in deciding whether findings entail this conclusion. In the data utilized here, there is some segregation of educational attainment PGS across schools, but an alternative hypothesis is available given the difference in expected returns, in the form of educational and occupational attainments, for a fixed educational attainment PGS across schools.
Our finding of a limited role for GxE in this context is perhaps unsurprising when one considers the methodology employed for the identification of the relevant genetic loci. GWAS is built to be a tool for the identification of single nucleotide polymorphisms (SNPs), whose variation is consistently associated with phenotypic variation. That is, polygenic scores are constructed based on SNPs that show the most reliable main effects and are thus less likely to be those loci that are particularly environmentally sensitive. If, for example, most GxE associations are those with effects whose signs vary as a function of environmental context—similar to a differential susceptibility model (Belsky and Pluess 2009) —then these SNPs are unlikely to be detected in a GWAS; simply differentiating loci that are true crossover SNPs from random variation is challenging (Boardman et al. 2014). Meta-analytic GWASs that combine data from a broad spectrum of places and time periods, as with the educational attainment GWAS, will identify only the genetic variants whose effects are robust to these environmental differences. Finally, because moderating environments may operate on a specific biological pathway, the act of summarizing thousands of different SNPs (that likely work through numerous biological pathways) into a single PGS complicates the detection of GxE.
We cannot rule out the moderation of all genetic effects on educational attainment, merely the ones emphasized in the educational attainment PGS studied here. Indeed, alternative methods based on genetic loci associated with variation in outcome (Conley et al. 2018) may provide different information about the consistency of genetic prediction across environments. Given the relevance of schools for life course attainments, this null finding provides important contextual information for the interpretation of current and forthcoming GWAS findings relating to educational attainment. Although we remain skeptical of the existence of substantial school-level moderation of the linear association between continuously measured attainments and the educational attainment PGS, our findings emphasize the importance of social context in the interpretation of genetic predictions. School context is crucial in connecting an individual’s genotype to his or her likelihood of crossing meaningful educational thresholds. Given our findings related to credentialing processes, conceptions of interplay between genes and environments should be expanded to include changes in levels associated with environmental context rather than simply changes in slopes.
Finally, it is important to recall that our results only apply to individuals with European ancestry in the two studies. We restricted our sample because differences in linkage disequilibrium and allele frequencies that exist across ancestral groups complicate the interpretation of PGS-phenotype associations (Martin et al. 2017). Although we recognize the importance of research in more diverse samples, our analysis is a first step in considering the role of the school environment in moderating the relationship between the educational attainment PGS and life course attainments.
Supplementary Material
Acknowledgements:
This work has been supported (in part) by award 96-17-04 from the Russell Sage Foundation and the Ford Foundation, the National Science Foundation Graduate Research Fellowship Program under grant DGE-1656518 (Trejo), the Institute of Education Sciences under grant R305B140009 (Trejo), and a Jacobs Foundation Early Career Research Fellowship (Belsky). This research uses Add Health GWAS data funded by the Eunice Kennedy Shriver National Institute of Child Health and Human Development grant R01 HD073342 to Kathleen Mullan Harris and the Eunice Kennedy Shriver National Institute of Child Health and Human Development and National Institutes of Health grant R01 HD060726 to Harris, Boardman, and McQueen. Add Health is a program project directed by Kathleen Mullan Harris and designed by J. Richard Udry, Peter S. Bearman, and Kathleen Mullan Harris at the University of North Carolina at Chapel Hill; it is funded by grant P01 HD31921 from the Eunice Kennedy Shriver National Institute of Child Health and Human Development with cooperative funding from 23 other federal agencies and foundations. The Wisconsin Longitudinal Study is directed by Pamela Herd, and the work conducted herein was supported by the National Institute on Aging (R01 AG041868-01A1 and P30 AG017266). This research benefitted from GWAS results made available by the Social Science Genetic Association Consortium. Any opinions expressed are those of the author(s) alone and should not be construed as representing the opinions of each foundation.
References
- Adkins Daniel E., and Vaisey Stephen. 2009. “Toward a Unified Stratification Theory: Structure, Genome, and Status across Human Societies.” Sociological Theory 27:99–121. 10.1111/j.1467-9558.2009.01339.x. [DOI] [Google Scholar]
- Athey S, and Imbens GW. 2017. “Chapter 3: The Econometrics of Randomized Experiments” Pp. 73–140 in Handbook of Economic Field Experiments. Vol. 1, Handbook of Field Experiments, edited by Banerjee AV and Duflo E. Amsterdam, Netherlands: North Holland Publishing. [Google Scholar]
- Bailey Martha J., and Dynarski Susan M.. 2011. "Gains and Gaps: Changing Inequality in US College Entry and Completion." Working Paper, National Bureau of Economic Research. [Google Scholar]
- Baker David P., Goesling Brian, and LeTendre Gerald K.. 2002. “Socioeconomic Status, School Quality, and National Economic Development: A Cross-national Analysis of the ‘Heyneman-Loxley Effect’ on Mathematics and Science Achievement.” Comparative Education Review 46:291–312. [Google Scholar]
- Barcellos Silvia H., Carvalho Leandro S., and Turley Patrick. 2018. “Education Can Reduce Health Disparities Related to Genetic Risk of Obesity: Evidence from a British Reform.” BioRxiv 260463 10.1101/260463. [DOI] [PMC free article] [PubMed] [Google Scholar]
- Barnard Wendy Miedel. 2004. “Parent Involvement in Elementary School and Educational Attainment.” Children and Youth Services Review 26:39–62. 10.1016/j.childyouth2003.11.002. [DOI] [Google Scholar]
- Belsky Daniel, Domingue Benjamin W., Wedow Robbee, Arseneault Louise, Boardman Jason D., Caspi Avshalom, Conley Dalton, Fletcher Jason M., Freese Jeremy, Herd Pamela, Moffitt Terrie E., Poulton Richie, Sicinski Kamil, Wertz Jasmin, and Harris Kathleen Mullan. 2018. “Genetic Analysis of Social-Class Mobility in Five Longitudinal Studies.” Proceedings of the National Academy of Sciences, first published on July 9, 2018 as doi: 10.1073/pnas.1801238115. 10.1073/pnas.1801238115. [DOI] [PMC free article] [PubMed] [Google Scholar]
- Belsky Daniel W., Moffitt Terrie E., Corcoran David L., Domingue Benjamin W., Harrington HonaLee, Hogan Sean, Houts Renate, Ramrakha Sandhya, Sugden Karen, Williams Benjamin, Poulton Richie, and Caspi Avshalom. 2016. “The Genetics of Success: How SNPs Associated with Educational Attainment Relate to Life Course Development.” Psychological Science 27:957–72. 10.1177/0956797616643070. [DOI] [PMC free article] [PubMed] [Google Scholar]
- Belsky Jay, and Pluess Michael. 2009. “Beyond Diathesis Stress: Differential Susceptibility to Environmental Influences.” Psychological Bulletin 135:885 10.1037/a0017376. [DOI] [PubMed] [Google Scholar]
- Boardman Jason D., Domingue Benjamin W., Blalock Casey L., Haberstick Brett C., Harris Kathleen Mullan, and McQueen Matthew B.. 2014. “Is the Gene–Environment Interaction Paradigm Relevant to Genome-Wide Studies? The Case of Education and Body Mass Index.” Demography 51:119–39. 10.1007/s13524-013-0259-4. [DOI] [PMC free article] [PubMed] [Google Scholar]
- Boardman Jason D., Domingue Benjamin W., and Fletcher Jason M.. 2012. “How Social and Genetic Factors Predict Friendship Networks.” Proceedings of the National Academy of Sciences 109:17377–81. 10.1073/pnas.1208975109. [DOI] [PMC free article] [PubMed] [Google Scholar]
- Boardman Jason D., Daw Jonathan, and Freese Jeremy. 2013. “Defining the Environment in Gene-Environment Research: Lessons from Social Epidemiology.” American Journal of Public Health 103:S64–S72. 10.2105/AJPH.2013.301355. [DOI] [PMC free article] [PubMed] [Google Scholar]
- Branigan Amelia R., McCallum Kenneth J., and Freese Jeremy. 2013. “Variation in the Heritability of Educational Attainment: An International Meta-analysis.” Social Forces 92:109–40. 10.1093/sf/sot076. [DOI] [Google Scholar]
- Card David, and Krueger Alan B.. 1992. “Does School Quality Matter? Returns to Education and the Characteristics of Public Schools in the United States.” Journal of Political Economy 100:1 10.1086/261805. [DOI] [Google Scholar]
- Chetty Raj, Friedman John N., and Rockoff Jonah E.. 2011. "The Long-term Impacts of Teachers: Teacher Value-Added and Student Outcomes in Adulthood." Working Paper, National Bureau of Economic Research. 10.1093/qje/qjr041. [DOI] [Google Scholar]
- Chetty Raj, Friedman John N., Hilger Nathaniel, Saez Emmanuel, Schanzenbach Diane Whitmore, and Yagan Danny. 2011. “How Does Your Kindergarten Classroom Affect Your Earnings? Evidence from Project STAR.” The Quarterly Journal of Economics 126:1593–660. [DOI] [PubMed] [Google Scholar]
- Coleman James S. 1968. “Equality of Educational Opportunity (COLEMAN) Study (EEOS).” Equity and Excellence in Education 6:19–28. 10.1080/0020486680060504. [DOI] [Google Scholar]
- Conley Dalton, Domingue Benjamin W., Cesarini David, Dawes Christopher, Rietveld Cornelius A., and Boardman Jason D.. 2015. “Is the Effect of Parental Education on Offspring Biased or Moderated by Genotype?” Sociological Science 2:82–105. https: 10.15195/v2.a6. [DOI] [PMC free article] [PubMed] [Google Scholar]
- Conley Dalton, Johnson Rebecca, Domingue Benjamin W., Dawes Christopher, Boardman Jason, and Siegal Mark L.. 2018. “A Sibling Method for Identifying VQTLs.” PloS One 13:e0194541 10.1371/journal.pone.0194541. [DOI] [PMC free article] [PubMed] [Google Scholar]
- Conley Dalton, Laidley Thomas M., Boardman Jason D., and Domingue Benjamin W.. 2016. “Changing Polygenic Penetrance on Phenotypes in the 20th Century among Adults in the US Population.” Scientific Reports 6:30348 10.1038/srep30348. [DOI] [PMC free article] [PubMed] [Google Scholar]
- Culverhouse RC, Saccone NL, Horton AC, Ma Y, Anstey KJ, Banaschewski T, Burmeister M, Cohen-Woods S, Etain B, Fisher HL, Goldman N, Guillaume S, Horwood J, Juhasz G, Lester KJ, Mandelli L, Middeldorp CM, Olie E, Villafuerte S, Air TM, Araya R, Bowes L, Burns R, Byrne EM, Coffey C, Coventry WL, Gawronski KAB, Glei D, Hatzimanolis A, Hottenga JJ, Jaussent I, Jawahar C, Jennen-Steinmetz C, Kramer JR, Lajnef M, Little K, zu Schwabedissen HM, Nauck M, Nederhof E, Petschner P, Peyrot WJ, Schwahn C, Sinnamon G, Stacey D, Tian Y, Toben C, Van der Auwera S, Wainwright N, Wang JC, Willemsen G, Anderson IM, Arolt V, Aslund C, Bagdy G, Baune BT, Bellivier F, Boomsma DI, Courtet P, Dannlowski U, de Geus EJC, Deakin JFW, Easteal S, Eley T, Fergusson DM, Goate AM, Gonda X, Grabe HJ, Holzman C, Johnson EO, Kennedy M, Laucht M, Martin NG, Munafò MR, Nilsson KW, Oldehinkel AJ, Olsson CA, Ormel J, Otte C, Patton GC, Penninx BWJH, Ritchie K, Sarchiapone M, Scheid JM, Serretti A, Smit JH, Stefanis NC, Surtees PG, Volzke H, Weinstein M, Whooley M, Nurnberger JI Jr, Breslau N, and Bierut LJ. 2017. “Collaborative Meta-analysis Finds No Evidence of a Strong Interaction between Stress and 5-HTTLPR Genotype Contributing to the Development of Depression.” Molecular Psychiatry 23:133–42. 10.1038/mp.2017.44. [DOI] [PMC free article] [PubMed] [Google Scholar]
- Domingue Benjamin W., Belsky Daniel W., Harrati Amal, Conley Dalton, Weir David, and Boardman Jason D.. 2017. “Mortality Selection in a Genetic Sample and Implications for Association Studies.” International Journal of Epidemiology 46:1285–94. 10.1093/ije/dyx041. [DOI] [PMC free article] [PubMed] [Google Scholar]
- Domingue Benjamin W., Belsky Daniel W., Conley Dalton, Harris Kathleen Mullan, and Boardman Jason D.. 2015. “Polygenic Influence on Educational Attainment: New Evidence from the National Longitudinal Study of Adolescent to Adult Health.” AERA Open 1:1–13. 10.1177/2332858415599972. [DOI] [PMC free article] [PubMed] [Google Scholar]
- Domingue Benjamin W., Belsky Daniel W., Fletcher Jason M., Conley Dalton, Boardman Jason D., and Harris Kathleen Mullan. 2018a. “The Social Genome of Friends and Schoolmates in the National Longitudinal Study of Adolescent to Adult Health.” Proceedings of the National Academy of Sciences 115:702–7. 10.1073/pnas.1711803115. [DOI] [PMC free article] [PubMed] [Google Scholar]
- Domingue Benjamin, Rehkopf David, Conley Dalton, and Boardman Jason D.. 2018b. “Geographic Clustering of Polygenic Scores at Different Stages of the Life Course.” The Russell Sage Foundation Journal of the Social Sciences 4:137–49. 10.7758/rsf2018.4.4.08. [DOI] [PMC free article] [PubMed] [Google Scholar]
- Dudbridge Frank. 2013. “Power and Predictive Accuracy of Polygenic Risk Scores.” PLoS Genetics 9:e1003348 10.1371/journal.pgen.1003348. [DOI] [PMC free article] [PubMed] [Google Scholar]
- Duncan Laramie E., and Keller Matthew C.. 2011. “A Critical Review of the First 10 Years of Candidate Gene-by-Environment Interaction Research in Psychiatry.” The American Journal of Psychiatry 168:1041–9. 10.1176/appi.ajp.2011.11020191. [DOI] [PMC free article] [PubMed] [Google Scholar]
- Eaves Lindon J. 2006. “Genotype x Environment Interaction in Psychopathology: Fact or Artifact?” Twin Research and Human Genetics 9:1–8. 10.1375/twin.9.1.1. [DOI] [PubMed] [Google Scholar]
- Ellis Bruce J., Boyce W. Thomas, Belsky Jay, Bakermans-Kranenburg Marian J., and Van IJzendoorn Marinus H.. 2011. “Differential Susceptibility to the Environment: An Evolutionary–Neurodevelopmental Theory.” Development and Psychopathology 23:7–28. 10.1017/S0954579410000611. [DOI] [PubMed] [Google Scholar]
- Figlio David N., Freese Jeremy, Karbownik Krzysztof, and Roth Jeffrey. 2017. “Socioeconomic Status and Genetic Influences on Cognitive Development.” Proceedings of the National Academy of Sciences 114:201708491 10.1073/pnas.1708491114. [DOI] [PMC free article] [PubMed] [Google Scholar]
- Fletcher Jason M., and Conley Dalton. 2013. “The Challenge of Causal Inference in Gene–Environment Interaction Research: Leveraging Research Designs from the Social Sciences.” American Journal of Public Health 103:S42–S45. 10.2105/AJPH.2013.301290. [DOI] [PMC free article] [PubMed] [Google Scholar]
- Fonagy Peter, Twemlow Stuart W., Vernberg Eric, Sacco Frank C., and Little Todd D.. 2005. “Creating a Peaceful School Learning Environment: The Impact of an Antibullying Program on Educational Attainment in Elementary Schools.” Medical Science Monitor 11:CR317–25. [PubMed] [Google Scholar]
- Fuller Bruce, and Clarke Prema. 1994. “Raising School Effects while Ignoring Culture? Local Conditions and the Influence of Classroom Tools, Rules, and Pedagogy.” Review of Educational Research 64:119–57. 10.3102/00346543064001119. [DOI] [Google Scholar]
- Harris Kathleen Mullan. 2013. The Add Health Study: Design and Accomplishments. Carolina Population Center. Chapel Hill, NC: University of North Carolina at Chapel Hill; Retrieved May 1, 2018 (http://www.cpc.unc.edu/projects/addhealth/documentation/guides/DesignPaperWIIV.pdf). [Google Scholar]
- Harris Kathleen Mullan, Halpern Carolyn Tucker, Hussey John, Whitsel Eric A., Killeya-Jones Ley, Tabor Joyce, Elder Glen, Hewitt John, Shanahan Michael, Williams Redford, Siegler Ilene, and Smolen Andrew. 2013. “Social, Behavioral, and Genetic Linkages from Adolescence into Adulthood.” American Journal of Public Health 103:S25–S32. 10.2105/AJPH2012.301181. [DOI] [PMC free article] [PubMed] [Google Scholar]
- Hauser Robert M., and Warren John Robert. 1997. “4. Socioeconomic Indexes for Occupations: A Review, Update, and Critique.” Sociological Methodology 27:177–298. 10.1111/1467-9531.271028. [DOI] [Google Scholar]
- Haworth Simon, Mitchell Ruth, Corbin Laura, Wade Kaitlin H., Dudding Tom, Budu-Aggrey Ashley, Carslake David, Hemani Gibran, Paternoster Lavinia, Smith George Davey, Davies Neil, Lawson Dan, and Timpson Nicholas. 2018. “Common Genetic Variants and Health Outcomes Appear Geographically Structured in the UK Biobank Sample: Old Concerns Returning and Their Implications.” BioRxiv 294876 https: 10.1101/294876. [DOI] [Google Scholar]
- Heckman James J., and LaFontaine Paul A.. 2010. “The American High School Graduation Rate: Trends and Levels.” The Review of Economics and Statistics 92:244–62. 10.1162/rest2010.12366. [DOI] [PMC free article] [PubMed] [Google Scholar]
- Herd Pamela, Carr Deborah, and Roan Carol. 2014. “Cohort Profile: Wisconsin Longitudinal Study (WLS).” International Journal of Epidemiology 43:34–41. 10.1093/ije/dys194. [DOI] [PMC free article] [PubMed] [Google Scholar]
- Hoover-Dempsey Kathleen V., Bassler Otto C., and Brissie Jane S.. 1987. “Parent Involvement: Contributions of Teacher Efficacy, School Socioeconomic Status, and Other School Characteristics.” American Educational Research Journal 24:417–35. https://doi.org/10 3102/00028312024003417. [Google Scholar]
- Jonsson Jan O., Grusky David B., Di Carlo Matthew, Pollak Reinhard, and Brinton Mary C.. 2009. “Microclass Mobility: Social Reproduction in Four Countries.” American Journal of Sociology 114:977–1036. 10.1086/596566. [DOI] [PubMed] [Google Scholar]
- Keller Matthew C. 2014. “Gene × Environment Interaction Studies Have Not Properly Controlled for Potential Confounders: The Problem and the (Simple) Solution.” Biological Psychiatry 75:18–24. 10.1016/j.biopsych.2013.09.006. [DOI] [PMC free article] [PubMed] [Google Scholar]
- Kendler Kenneth S., and Baker Jessica H.. 2007. “Genetic Influences on Measures of the Environment: A Systematic Review.” Psychological Medicine 37:615–26. https://doi org/10.1017/S0033291706009524. [DOI] [PubMed] [Google Scholar]
- Kong Augustine, Thorleifsson Gudmar, Frigge Michael L., Vilhjalmsson Bjarni J., Young Alexander I., Thorgeirsson Thorgeir E., Benonisdottir Stefania, Oddsson Asmundur, Halldorsson Bjarni V., Masson Gisli, Gudbjartsson Daniel F., Helgason Agnar, Bjornsdottir Gyda, Thorsteinsdottir Unnur, and Stefansson Kari. 2018. “The Nature of Nurture: Effects of Parental Genotypes.” Science 359:424–8. 10.1126/science.aan6877. [DOI] [PubMed] [Google Scholar]
- Krapohl E, Hannigan LJ, Pingault JB, Patel H, Kadeva N, Curtis C, Breen G, New- house SJ, Eley TC, O’Reilly PF, and Plomin R. 2017. “Widespread Covariation of Early Environmental Exposures and Trait-Associated Polygenic Variation.” Proceedings of the National Academy of Sciences 114:11727–32. 10.1073/pnas.1707178114. [DOI] [PMC free article] [PubMed] [Google Scholar]
- Kuczmarski Robert J., Flegal Katherine M., Campbell Stephen M., and Johnson Clifford L.. 1994. “Increasing Prevalence of Overweight among US Adults: The National Health and Nutrition Examination Surveys, 1960 to 1991.” Journal of the American Medical Association 272:205–11. 10.1001/jama.1994.03520030047027. [DOI] [PubMed] [Google Scholar]
- Lee J, Wedow R, Okbay A, Kong E, Maghzian O, Zacher M, Johannesson M, Koellinger PD, Turley P, Visscher PM, Benjamin DJ, and Cesarini D. Forthcoming. “Gene Discovery and Polygenic Prediction from a 1.1-Million-Person GWAS of Educational Attainment.” Nature Genetics. [Google Scholar]
- Liu Hexuan, and Guo Guang. 2015. “Lifetime Socioeconomic Status, Historical Context, and Genetic Inheritance in Shaping Body Mass in Middle and Late Adulthood.” American Sociological Review 80:705–37. 10.1177/0003122415590627. [DOI] [PMC free article] [PubMed] [Google Scholar]
- Martin Alicia R., Gignoux Christopher R., Walters Raymond K., Wojcik Genevieve L., Neale Benjamin M., Gravel Simon, Daly Mark J., Bustamante Carlos D., and Kenny Eimear E.. 2017. “Human Demographic History Impacts Genetic Risk Prediction across Diverse Populations.” The American Journal of Human Genetics 100:635–49. 10.1016/j.ajhg2017.03.004. [DOI] [PMC free article] [PubMed] [Google Scholar]
- Mood Carina. 2017. “More than Money: Social Class, Income, and the Intergenerational Persistence of Advantage.” Sociological Science 4:263–87. 10.15195/v4.a12. [DOI] [Google Scholar]
- Munafò Marcus R., and Flint Jonathan. 2009. “Replication and Heterogeneity in Gene x Environment Interaction Studies.” International Journal of Neuropsychopharmacology 12:727–9. 10.1017/S1461145709000479. [DOI] [PubMed] [Google Scholar]
- Okbay Aysu, Beauchamp Jonathan P., Fontana Mark Alan, Lee James J., Pers Tune H., Rietveld Cornelius A., Turley Patrick, Chen Guo-Bo, Emilsson Valur, Meddens S. Fleur W., Oskarsson Sven, Pickrell Joseph K., Thom Kevin, Timshel Pascal, Ronald de Vlaming Abdel Abdellaoui, Ahluwalia Tarunveer S., Bacelis Jonas, Baumbach Clemens, Bjornsdottir Gyda, Brandsma Johannes H., Concas Maria Pina, Derringer Jaime, Furlotte Nicholas A., Galesloot Tessel E., Girotto Giorgia, Gupta Richa, Hall Leanne M., Harris Sarah E., Hofer Edith, Horikoshi Momoko, Huffman Jennifer E., Kaasik Kadri, Kalafati Ioanna P., Karlsson Robert, Kong Augustine, Lahti Jari, van der Lee Sven J., Christiaan deLeeuw, Lind Penelope A., Lindgren Karl-Oskar, Liu Tian, Mangino Massimo, Marten Jonathan, Mihailov Evelin, Miller Michael B., van der Most Peter J., Old- meadow Christopher, Payton Antony, Pervjakova Natalia, Peyrot Wouter J., Qian Yong, Raitakari Olli, Rueedi Rico, Salvi Erika, Schmidt Bürge, Schraut Katharina E., Shi Jianxin, Smith Albert V., Poot Raymond A., St. Pourcain Beate, Teumer Alexander, Thorleifsson Gudmar, Verweij Niek, Vuckovic Dragana, Wellmann Juergen, Westra Harm-Jan, Yang Jingyun, Zhao Wei, Zhu Zhihong, Alizadeh Behrooz Z., Amin Najaf, Bakshi Andrew, Baumeister Sebastian E., Biino Ginevra, Bønnelykke Klaus, Boyle Patricia A., Campbell Harry, Cappuccio Francesco P., Davies Gail, De Neve Jan-Emmanuel, Deloukas Panos, Demuth Ilja, Ding Jun, Eibich Peter, Eisele Lewin, Eklund Niina, Evans David M., Faul Jessica D., Feitosa Mary F., Forstner Andreas J., Gandin Ilaria, Gunnarsson Bjarni, Halldórsson Bjarni V., Harris Tamara B., Heath Andrew C., Hocking Lynne J., Holliday Elizabeth G., Homuth Georg, Horan Michael A., Hottenga Jouke-Jan, de Jager Philip L., Joshi Peter K., Jugessur Astanand, Kaakinen Marika A., Kähönen Mika, Kanoni Stavroula, Keltigangas-Järvinen Liisa, Kiemeney Lambertus A. L. M., Kolcic Ivana, Koskinen Seppo, Kraja Aldi T., Kroh Martin, Kutalik Zoltán, Latvala Antti, Launer Lenore J., Lebreton Maël P., Levinson Douglas F., Lichtenstein Paul, Lichtner Peter, Liewald David C. M., Loukola Anu, Madden Pamela A., Mägi Reedik, Mäki-Opas Tomi, Marioni Riccardo E., Marques-Vidal Pedro, Meddens Gerardus A., McMahon George, Meisinger Christa, Meitinger Thomas, Milaneschi Yusplitri, Milani Lili, Montgomery Grant W., Myhre Ronny, Nelson Christopher P., Nyholt Dale R., Ollier William E. R., Palotie Aarno, Paternoster Lavinia, Pedersen Nancy L., Petrovic Katja E., Porteous David J., Räikkönen Katri, Ring Susan M., Robino Antonietta, Rostapshova Olga, Rudan Igor, Rustichini Aldo, Salomaa Veikko, Sanders Alan R., Sarin Antti-Pekka, Schmidt Helena, Scott Rodney J., Smith Blair H., Smith Jennifer A., Staessen Jan A., Elisabeth Steinhagen-Thiessen Konstantin Strauch, Terracciano Antonio, Tobin Martin D., Ulivi Sheila, Vaccargiu Simona, Quaye Lydia, van Rooij Frank J. A., Venturini Cristina, Vinkhuyzen Anna A. E., Völker Uwe, Völzke Henry, Vonk Judith M., Vozzi Diego, Waage Johannes, Ware Erin B., Willemsen Gonneke, Attia John R., Bennett David A., Berger Klaus, Bertram Lars, Bisgaard Hans, Boomsma Dorret I., Borecki Ingrid B., Bültmann Ute, Chabris Christopher F., Cucca Francesco, Cusi Daniele, Deary Ian J., Dedoussis George V., van Duijn Cornelia M., Eriksson Johan G., Franke Barbara, Franke Lude, Gasparini Paolo, Gejman Pablo V., Gieger Christian, Grabe Hans-Jörgen, Gratten Jacob, Groenen Patrick J. F., Gudnason Vilmundur, van der Harst Pim, Hayward Caroline, Hinds David A., Hoffmann Wolfgang, Hyppönen Elina, Iacono William G., Jacobsson Bo, Järvelin Marjo-Riitta, Jöckel Karl-Heinz, Kaprio Jaakko, Kardia Sharon L. R., Lehtimäki Terho, Lehrer Steven F., Magnusson Patrik K. E., Martin Nicholas G., Matt McGue Andres Metspalu, Pendleton Neil, Penninx Brenda W. J. H., Perola Markus, Pirastu Nicola, Pirastu Mario, Polašek Ozren, Posthuma Danielle, Power Christine, Province Michael A., Samani Nilesh J., Schlessinger David, Schmidt Reinhold, Sørensen Thorkild I. A., Spector Tim D., Stefansson Kari, Thorsteinsdottir Unnur, Thurik A. Roy, Timpson Nicholas J., Tiemeier Henning, Tung Joyce Y., Uitterlinden André G., Vitart Veronique, Vollenweider Peter, Weir David R., Wilson James F., Wright Alan F., Conley Dalton C., Krueger Robert F., Davey Smith George, Hofman Albert, Laibson David I., Medland Sarah E., Meyer Michelle N., Yang Jian, Johannesson Magnus, Visscher Peter M., Esko Tõnu, Koellinger Philipp D., Cesariniand David, and Benjamin Daniel J.; LifeLines Cohort Study. 2016. “Genome-Wide Association Study Identifies 74 Loci Associated with Educational Attainment.” Nature 533:539–42. [DOI] [PMC free article] [PubMed] [Google Scholar]
- Papageorge Nicholas W., and Thom Kevin. 2016. “Genes, Education, and Labor Market Outcomes: Evidence from the Health and Retirement Study.” Working Paper, W. E. Upjohn Institute for Employment Research. [DOI] [PMC free article] [PubMed] [Google Scholar]
- Perry Laura B., and McConney Andrew. 2010. “Does the SES of the School Matter? An Examination of Socioeconomic Status and Student Achievement Using PISA 2003.” Teachers College Record 112:1137–62. [Google Scholar]
- Plomin Robert, and Bergeman Cindy S.. 1991. “The Nature of Nurture: Genetic Influence on ‘Environmental’ Measures.” Behavioral and Brain Sciences 14:373–86. 10.1017/S0140525X00070278. [DOI] [Google Scholar]
- Polderman Tinca J. C., Benyamin Beben, de Leeuw Christiaan A., Sullivan Patrick F., van Bochoven Arjen, Visscher Peter M., and Posthuma Danielle. 2015. “Meta-analysis of the Heritability of Human Traits Based on Fifty Years of Twin Studies.” Nature Genetics 47:702–9. 10.1038/ng.3285. [DOI] [PubMed] [Google Scholar]
- Raudenbush Stephen W., and Willms J. Douglas. 1995. “The Estimation of School Effects.” Journal of Educational and Behavioral Statistics 20:307–35. 10.3102/10769986020004307. [DOI] [Google Scholar]
- Rietveld Cornelius A., Medland Sarah E., Derringer Jaime, Yang Jian, Esko Tõnu, Martin Nicolas W., Westra Harm-Jan, Shakhbazov Konstantin, Abdellaoui Abdel, Agrawal Arpana, Albrecht Eva, Alizadeh Behrooz Z., Amin Najaf, Barnard John, Baumeister Sebastian E., Benke Kelly S., Bielak Lawrence F., Boatman Jeffrey A., Boyle Patricia A., Davies Gail, Christiaan de Leeuw Niina Eklund, Evans Daniel S., Ferhmann Rudolf, Fischer Krista, Gieger Christian, Gjessing Håkon K., Hägg Sara, Harris Jennifer R., Hayward Caroline, Holzapfel Christina, Ibrahim-Verbaas Carla A., Ingelsson Erik, Jacobsson Bo, Joshi Peter K., Jugessur Astanand, Kaakinen Marika, Kanoni Stavroula, Karjalainen Juha, Kolcic Ivana, Kristiansson Kati, Kutalik Zoltán, Lahti Jari, Lee Sang H., Lin Peng, Lind Penelope A., Liu Yongmei, Lohman Kurt, Loitfelder Marisa, McMahon George, Vidal Pedro Marques, Meirelles Osorio, Milani Lili, Myhre Ronny, Nuotio Marja-Liisa, Oldmeadow Christopher J., Petrovic Katja E., Peyrot Wouter J., Polašek Ozren, Quaye Lydia, Reinmaa Eva, Rice John P., Rizzi Thais S., Schmidt Helena, Schmidt Reinhold, Smith Albert V., Smith Jennifer A., Tanaka Toshiko, Terracciano Antonio, van der Loos Matthijs J. H. M., Vitart Veronique, Völzke Henry, Wellmann Jürgen, Yu Lei, Zhao Wei, Allik Jüri, Attia John R., Bandinelli Stefania, Bastardot François, Beauchamp Jonathan, Bennett David A., Berger Klaus, Bierut Laura J., Boomsma Dorret I., Bültmann Ute, Campbell Harry, Chabris Christopher F., Cherkas Lynn, Chung Mina K., Cucca Francesco, de Andrade Mariza, De Jager Philip L., De Neve Jan-Emmanuel, Deary Ian J., Dedoussis George V., Deloukas Panos, Dimitriou Maria, Eiriksdottir Gudny, Elderson Martin F., Eriksson Johan G., Evans David M., Faul Jessica D., Ferrucci Luigi, Garcia Melissa E., Grönberg Henrik, Gudnason Vilmundur, Hall Per, Harris Juliette M., Harris Tamara B., Hastie Nicholas D., Heath Andrew C., Hernandez Dena G., Hoffmann Wolfgang, Hofman Adriaan, Holle Rolf, Holliday Elizabeth G., Hottenga Jouke-Jan, Iacono William G., Illig Thomas, Järvelin Marjo-Riitta, Kähönen Mika, Kaprio Jaakko, Kirkpatrick Robert M., Kowgier Matthew, Latvala Antti, Launer Lenore J., Lawlor Debbie A., Lehtimäki Terho, Li Jingmei, Lichtenstein Paul, Lichtner Peter, Liewald David C., Madden Pamela A., Magnusson Patrik K. E., Mäkinen Tomi E., Masala Marco, McGue Matt, Metspalu Andres, Mielck Andreas, Miller Michael B., Montgomery Grant W., Mukherjee Sutapa, Nyholt Dale R., Oostra Ben A., Palmer Lyle J., Palotie Aarno, Penninx Brenda, Perola Markus, Peyser Patricia A., Preisig Martin, Räikkönen Katri, Raitakari Olli T., Realo Anu, Ring Susan M., Ripatti Samuli, Rivadeneira Fernando, Rudan Igor, Rustichini Aldo, Salomaa Veikko, Sarin Antti-Pekka, Schlessinger David, Scott Rodney J., Snieder Harold, St. Pourcain Beate, Starr John M., Sul Jae Hoon, Surakka Ida, Svento Rauli, Teumer Alexander, Tiemeier Henning, Rooij Frank JAan, Van Wagoner David R., Vartiainen Erkki, Viikari Jorma, Vollenweider Peter, Vonk Judith M., Waeber Gérard, Weir David R., Wichmann H.-Erich, Widen Elisabeth, Willemsen Gonneke, Wilson James F., Wright Alan F., Conley Dalton, Davey-Smith George, Franke Lude, Groenen Patrick J. F., Hofman Albert, Johannesson Magnus, Kardia Sharon L. R., Krueger Robert F., Laibson David, Martin Nicholas G., Meyer Michelle N., Posthuma Danielle, Thurik A. Roy, Timpson Nicholas J., Uitterlinden André G., van Duijn Cornelia M., Visscher Peter M., Benjamin Daniel J., Cesarini David, and Koellinger Philipp D.; LifeLines Cohort Study. 2013. “GWAS of 126,559 Individuals Identifies Genetic Variants Associated with Educational Attainment.” Science 340:1467–71. [DOI] [PMC free article] [PubMed] [Google Scholar]
- Rietveld Cornelius A., Conley Dalton, Eriksson Nicholas, Esko Tõnu, Medland Sarah E., Vinkhuyzen Anna A. E., Yang Jian, Boardman Jason D., Chabris Christopher F., Dawes Christopher T., Domingue Benjamin W., Hinds David A., Johannesson Magnus, Kiefer Amy K., Laibson David, Magnusson Patrik K. E., Mountain Joanna L., Oskarsson Sven, Rostapshova Olga, Teumer Alexander, Tung Joyce Y., Visscher Peter M., Benjamin Daniel J., Cesarini David, and Koellinger Philipp D.; Social Science Genetics Association Consortium. 2014. “Replicability and Robustness of Genome-Wide-Association Studies for Behavioral Traits.” Psychological Science 25:1975–86. https: 10.1177/0956797614545132. [DOI] [PMC free article] [PubMed] [Google Scholar]
- Rimfeld Kaili, Krapohl Eva, Trzaskowski Maciej, Coleman Jonathan R. I., Selzam Saskia, Dale Philip S., Esko Tõnu, Metspalu Andres, and Plomin Robert. 2018. “Genetic Influence on Social Outcomes during and after the Soviet Era in Estonia.” Nature Human Behaviour 2:269–75. 10.1038/s41562-018-0332-5. [DOI] [PMC free article] [PubMed] [Google Scholar]
- Smith-Woolley Emily, Pingault Jean-Baptiste, Selzam Saskia, Rimfeld Kaili, Krapohl Eva, Sophie von Stumm Kathryn Asbury, Dale Philip S., Young Toby, Allen Rebecca, Kovas Yulia, and Plomin Robert. 2018. “Differences in Exam Performance between Pupils Attending Selective and Non-Selective Schools Mirror the Genetic Differences between Them.” NPJ Science of Learning 3, Article 3. [DOI] [PMC free article] [PubMed] [Google Scholar]
- Tchetgen Eric J., and Kraft Peter. 2011. “On the Robustness of Tests of Genetic Associations Incorporating Gene–Environment Interaction when the Environmental Exposure Is Misspecified.” Epidemiology 22:257–61. [DOI] [PMC free article] [PubMed] [Google Scholar]
- Tropf Felix C., Lee S. Hong, Verweij Renske M., Stulp Gert, van der Most Peter J., de Vlaming Ronald, Bakshi Andrew, Briley Daniel A., Rahal Charles, Hellpap Robert, Iliadou Anastasia N., Esko Tonu, Metspalu Andres, Medland Sarah E., Martin Nicholas G., Barban Nicola, Snieder Harold, Robinson Matthew R., and Mills Melinda C.. 2017. “Hidden Heritability Due to Heterogeneity across Seven Populations.” Nature Human Behaviour 1:757–65. 10.1038/s41562-017-0195-1. [DOI] [PMC free article] [PubMed] [Google Scholar]
- Tucker-Drob Elliot M., and Bates Timothy C.. 2015. “Large Cross-national Differences in Gene x Socioeconomic Status Interaction on Intelligence.” Psychological Science 27:138–49. 10.1177/0956797615612727. [DOI] [PMC free article] [PubMed] [Google Scholar]
- Turkheimer Eric, Haley Andreana, Waldron Mary, D’Onofrio Brian, and Gottesman Irving I.. 2003. “Socioeconomic Status Modifies Heritability of IQ in Young Children.” Psychological Science 14:623–8. 10.1046/j.0956-7976. [DOI] [PubMed] [Google Scholar]
- Walter Stefan, Iván Mejía-Guevara Karol Estrada, Liu Sze Y., and Glymour M. Maria. 2016. “Association of a Genetic Risk Score with Body Mass Index across Different Birth Cohorts.” Journal of the American Medical Association 316:63–69. 10.1001/jama.2016.8729. [DOI] [PubMed] [Google Scholar]
- Young-Wolff Kelly C., Enoch Mary-Anne, and Prescott Carol A.. 2011. “The Influence of Gene–Environment Interactions on Alcohol Consumption and Alcohol Use Disorders: A Comprehensive Review.” Clinical Psychology Review 31:800–16. 10.1016/j.cpr2011.03.005. [DOI] [PMC free article] [PubMed] [Google Scholar]
Associated Data
This section collects any data citations, data availability statements, or supplementary materials included in this article.