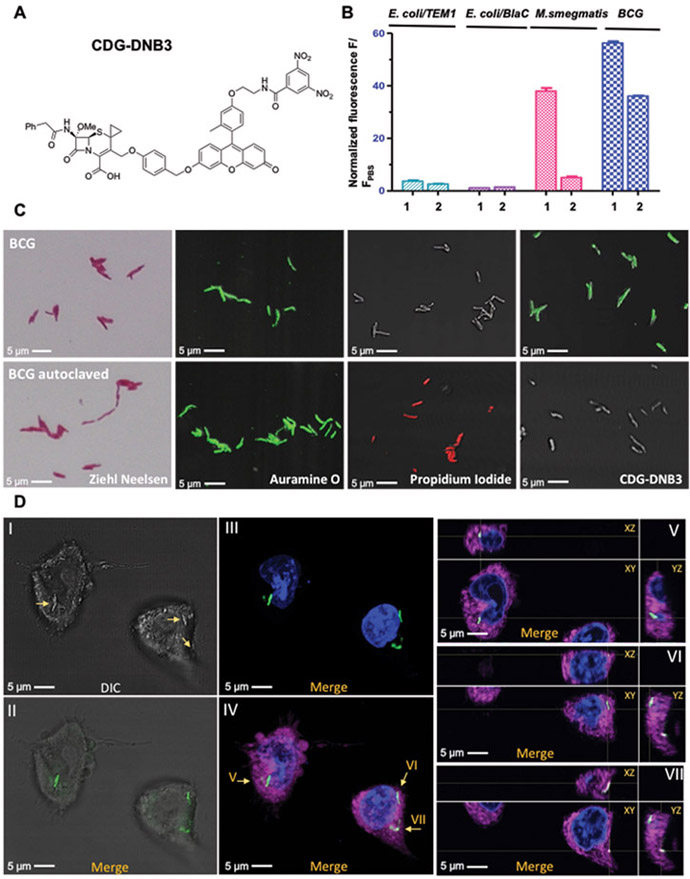
Fig. 4. Specific labeling of live Mtb by CDG-DNB3.
A) Structure of CDG-DNB3. B) Histogram of fluorescence activated flow cytometry analysis with freshly cultured E. coli (TOP10) expressing TEM-1 β-lactamase, E. coli (TOP10) expressing BlaC, M. smegmatis and BCG stained with 10 μM CDG-DNB2 or CDG-DNB3 in PBS at room temperature for 1 hour. 1: CDG-DNB2 treated group; 2: CDG-DNB3 treated group. C) Microscopic imaging of freshly cultured (top row) and 121°C autoclaved (bottom row) BCG stained by Ziehl-Neelsen reagents, auramine O (green; excitation, 490 nm; emission, 520 nm), PI (red; excitation, 535 nm; emission, 617 nm), or CDG-DNB3 (10 μM, 1 hour). D) Infection of macrophages by CDG-DNB3-labeled individual BCG bacilli: (I) bright-field image of BCG-infected macrophages (bacilli are indicated by arrows); (II) overlay of bright-field and fluorescence images showing the localization of CDG-DNB3 stained bacilli (green; excitation, 490 nm; emission, 520 nm); (III) overlay of fluorescence images showing the bacilli (green) and 4’,6-diamidino-2-phenylindole (DAPI) stained nucleus (blue; excitation, 358 nm; emission, 461 nm); (IV) overlay of fluorescence image showing the bacilli, nucleus, and the macrophage plasma membrane (magenta; excitation, 649 nm; emission, 666 nm); (V to VII) orthogonal views (XY, XZ, YZ) of the bacilli indicated by arrows in (IV). ImageJ was used for image processing and stack projection.

