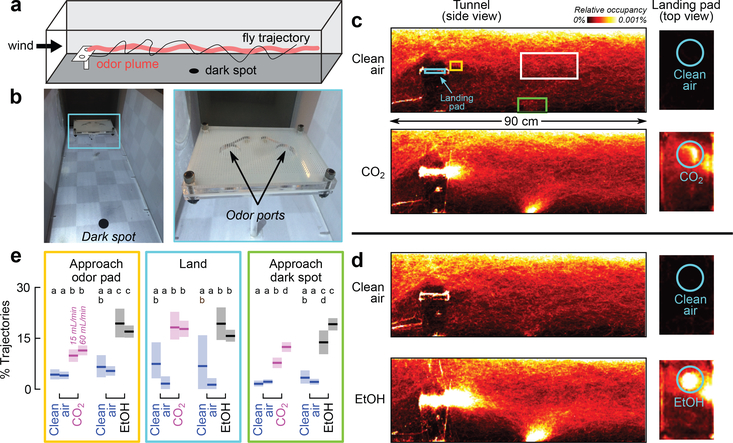
Figure 1 |. Drosophila are attracted to ethanol and CO2 in flight.
a, Diagram of wind tunnel. b, Photograph of the wind tunnel and odor-emitting landing platform. c, d Heat-maps indicating relative occupancy of flies in the presence of either CO2 or ethanol. Cohorts of 12 flies were introduced into the wind tunnel and their behavior recorded over 16 hrs. Throughout the experiment, 100 mL min−1 of clean air emerged from both odor ports. For 30 min every hour, 60 mL min−1 of either CO2 or clean air bubbled through 100% ethanol, was added to one odor port. Control data come from segments with clean air. Number of cohorts: 9 (CO2), 6 (ethanol). Number of trajectories: 59,970 – 101,539 per panel. e, Percent of trajectories that passed through one of the colored volumes shown in c (gold, cyan, green) after also passing through a control volume (white or gold). Approaches to landing pad: gold-from-white; landings: cyan-from-gold; approaches to dark spot: green-from-white. Number of trajectories per condition: 44–1288 (control), 228–1815 (odor). Experiments were performed at two concentrations: 15 mL min−1 (left data) and 60 mL min−1 (right data). Letters above data indicate statistically significant groups (2-tailed Mann-Whitney U test at p<0.05 with 8-way Bonferoni corrections). In all panels, shading indicates bootstrapped 95% CI around the mean.

