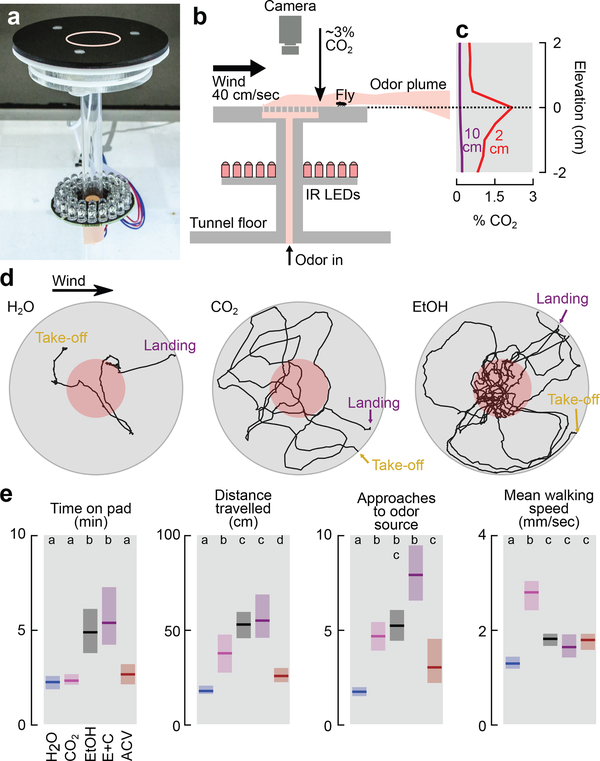
Figure 2 |. Walking Drosophila are attracted to CO2.
a, Photograph of landing platform. b, Cross-sectional diagram of the landing platform. c, CO2 concentration for two altitude transects 2 cm and 10 cm downwind from the platform at a 60 mL min−1 flow rate added to 100 mL min−1 of clean air (Extended Data Fig. 2a-b). d, Stereotypical trajectories. e, Four descriptive statistics summarizing flies’ behavior in response to different odors. Flow rate was 60 mL min−1 for each odor added to 100 mL min−1 of clean air. ACV = Apple Cider Vinegar. E+C = 60 mL min−1 clean air bubbled through ethanol with 15 mL min−1 of CO2 added. See Extended Data Fig. 2c for additional flow rates. Shading indicates bootstrapped 95% CI around the median. N trajectories = 125–193 per odor. Approaches to odor = number of times trajectories entered the red region in d. Letters above data indicate statistically significant groups (2-tailed Mann-Whitney U test at p<0.05 with 5-way Bonferoni corrections).

