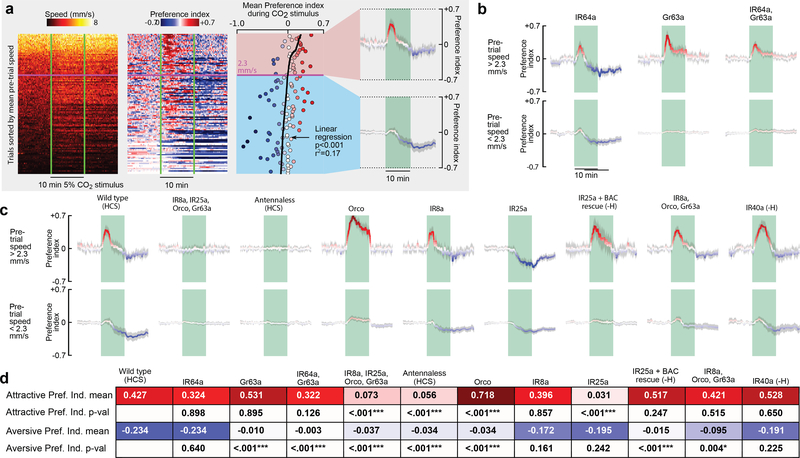
Figure 4 |. Attraction and aversion to CO2 are mediated by separate chemosensory pathways.
a, Data from 10 cohorts of flies with a 5% CO2 stimulus sorted by the mean speed (S) during a reference period 5 min prior to stimulus presentation (). To achieve a range of baseline activities, 4 cohorts were starved for 24 hrs, 3 starved for 3 hrs, and 3 starved for 3 hrs and heated to 32° C, N = 112 trials. Preference index (PI) was calculated in two steps: (1) PI0 = (Nodor − Ncontrol)/Ntotal; (2) . Where N = number of flies, and Ntotal=10. We determined the linear regression for the mean PI during the stimulus with respect to and used the intercept to cluster the data into high and low activity groups. For these groups, we calculated the mean PI over time. b-c, Data plotted as in last panel of a, for different manipulations and mutants, using the intercept of 2.3 mm s−1 found in a to cluster the data. All flies were presented with randomly interleaved stimuli of 0% or 5% (5% responses are shown here, see Extended Data Fig. 5 for 0% responses). N = 16 – 110 trials per condition. Shading indicates bootstrapped 95% CI around the mean for a-c. d, Summary of statistics for each mutant. Top row shows the mean largest PI for the active group during the stimulus. Third row shows the mean smallest PI for the inactive group during the stimulus. Second and fourth rows show the p-values for a 2-tailed Kolmogorov-Smirnov test between the mutant and wild type. Bonferoni-corrected statistically significant differences are indicated with asterisks (***: p<0.005; **: p<0.01; *: p<0.05). For mutants followed by (-H) we omitted the data collected at 32°, because our analysis found these flies did not respond to CO2, despite responding under more natural 24 hr-starved conditions (see Extended Data Fig. 6).

