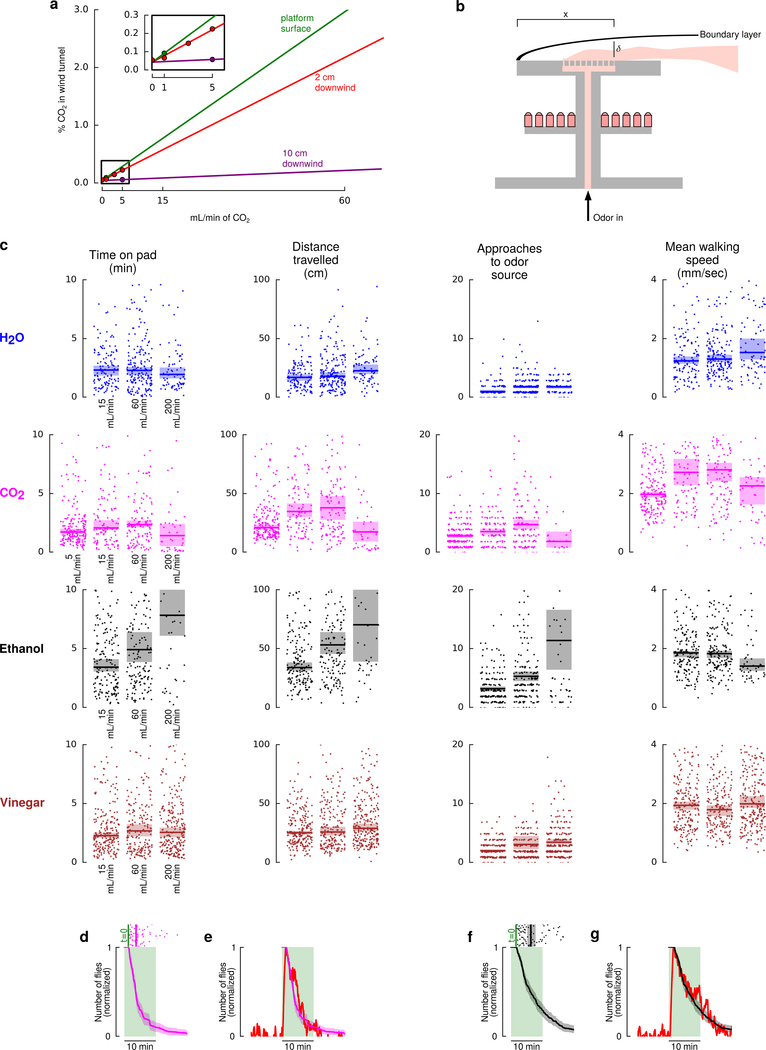
Extended Data Figure 2 |. Flies’ responses to odors at different concentrations.
a, CO2 concentration on the landing platform (green), and at two distances downwind from the downwind edge of the platform (red, purple). Measurements (shown with points) were made for low flow rates (see inset), and values at larger flowrates were extrapolated based on a linear model for measurements made at the 2 cm distance. This was necessary because the CO2 sensor could not accurately report concentrations higher than 0.5% CO2. b, Diagram illustrating the theoretical boundary layer used to confirm our measurements (see Methods). c, Flies’ responses to odors is consistent across a wide range of concentrations. Data plotted as in Fig. 3e, for additional flow rates. Points indicate individual data points (each trajectory contributes a single point). For each odor we recorded the following N = number of trajectories for each of the concentrations (listed left to right). H2O: 128, 183, 79; CO2: 195, 106, 125, 48; Ethanol: 173, 171, 47; Vinegar: 219, 193, 248. In all panels, shading indicates bootstrapped 95% confidence intervals around the median. d, Walking flies in this constrained arena show a similar CO2 attraction time course compared to flies in our wind tunnel. Scattergram shows the amount of time each fly spent searching the odor platform in the wind tunnel from Fig. 2a in the presence of 60 mL min−1 CO2 (data is repeated from Fig. 2e). Time trace is the bootstrapped mean and 95% confidence intervals for the normalized number of flies that would have been on the platform had all the flies landed simultaneously. The green shading is only provided for reference – the odor was never turned off in these wind tunnel experiments. e, Time trace from d overlaid on the normalized number of un-starved flies near the 5% CO2 source during the dusk time period in the walking arena, copied from Fig. 4d. f, Same as d, but for ethanol. g, Time trace from f overlaid on the normalized number of un-starved flies near the 5% ethanol source during the dusk time period in the walking arena, (data are not shown, but very similar to Fig. 3d ethanol case with starved flies). We chose un-starved flies for the comparisons because wind tunnel experiments were done with un-starved flies. We chose the 60 mL min−1 case because the CO2 concentration in the wind tunnel matches the 5% CO2 stimulus in the walking experiments.

