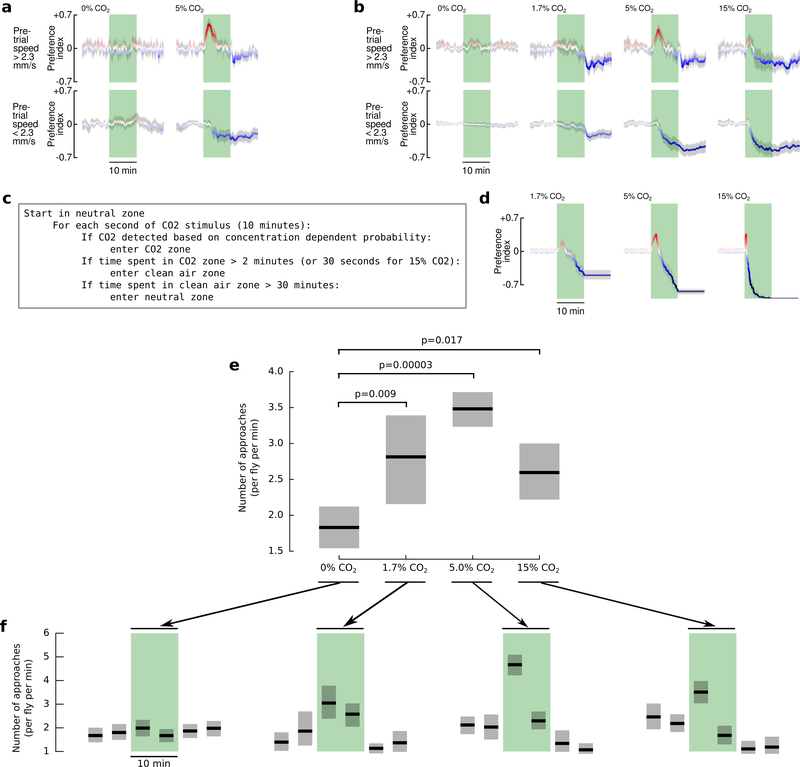
Extended Data Figure 4 |. Responses to CO2 are strongest at 5% concentration, and are unaffected by social dynamics.
a, Control and 5% CO2 responses for individual flies. For these experiments, we starved a single 2-day old wildtype (HCS) female fly for either 24 hrs or 3 hrs prior to starting the experiment. In every other way, the data is plotted as in Fig. 4. The data shown were collected from N = 29 individual flies, where each fly was subject to a 20-hour long experiment with N= 14 5% CO2 stimuli and N = 10 control stimuli. b, CO2 responses exhibited by flies to three concentrations of CO2. For these experiments, we starved groups of 10 flies for 24 hrs prior to starting the experiment. Flies were presented with 0%, 1.7%, or 5% CO2 in one set of experiments, and 0% or 15% in another set. Data are plotted as in Fig. 4. N = 20–170 trials per condition. To explain the complex dynamics of the approach behavior under the different CO2 concentrations, we made a very simple agent-based model with the pseudocode shown in c, see Supplemental Materials for additional discussion. d, Dynamics of flies’ CO2 attraction can be explained with by the simple agent-based model described in c. Preference indices are shown for the results of N = 100 iterations of the model under three different CO2 concentrations. The data are plotted in the same manner as b. The key insight offered by this model is that although our agents were programmed to exhibit the same behavior towards 1.7% and 5% CO2, the decreased likelihood of them detecting the lower concentration CO2 in conjunction with the long-term aversion results in an apparent indifference towards low concentrations of CO2. e, To show that flies are indeed attracted to the low (1.7%) concentration of CO2, we used a different analysis, which calculated the number of times that flies approached the CO2 source during the course of each 10 min stimulus. Pairwise statistics were determined with the 2-sample Kolmogorov-Smirnov test (test statistics were 0.57, 0.83, 0.41 for comparisons between 0% and 1.7%, 5%, and 15%). f, Time course of the number of times that flies approach the CO2 source, in 5-minute intervals. In each panel, shading shows bootstrapped 95% confidence intervals around the mean.

