. 2018 Oct 24;68(1):116–123. doi: 10.1097/MPG.0000000000002168
Copyright © 2018 The Author(s). Published by Wolters Kluwer Health, Inc. on behalf of the European Society for Pediatric Gastroenterology, Hepatology, and Nutrition and the North American Society for Pediatric Gastroenterology, Hepatology, and Nutrition
This is an open access article distributed under the Creative Commons Attribution License 4.0 (CCBY), which permits unrestricted use, distribution, and reproduction in any medium, provided the original work is properly cited. http://creativecommons.org/licenses/by/4.0
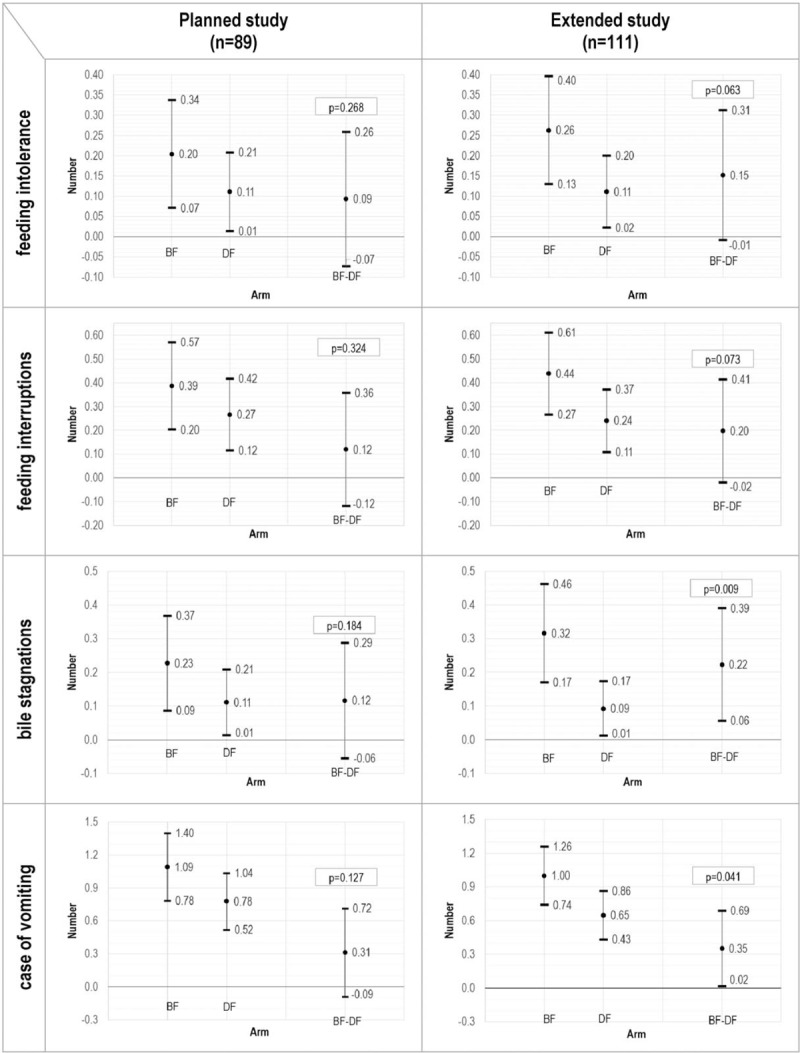
FIGURE 3.

Secondary endpoints (on PP population): means, mean differences, and 95% confidence intervals.
