
Figure 3.
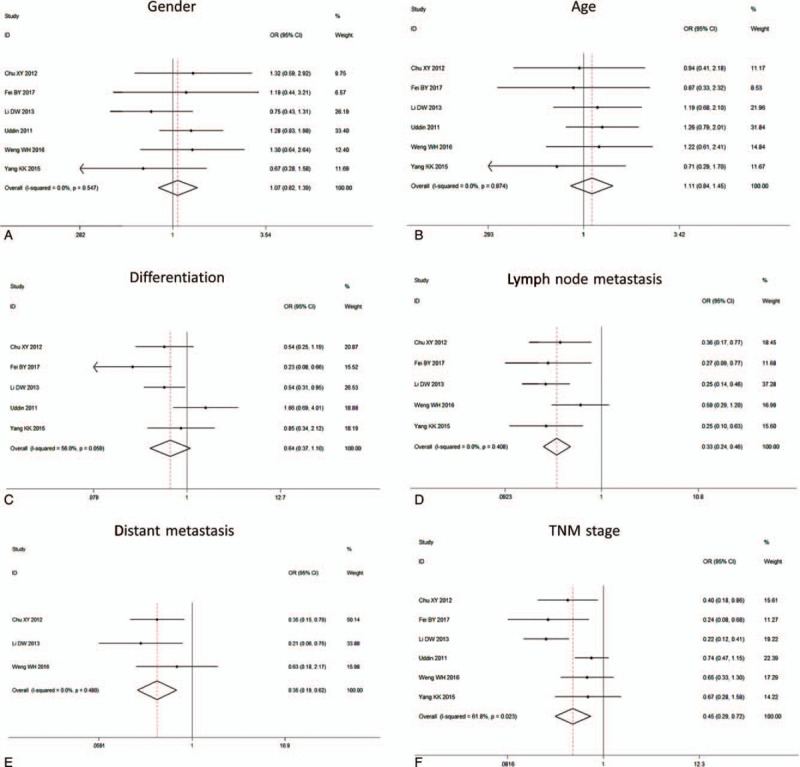
The forest plot of ORs for the association between FoxM1 expression and the A: gender, B: age, C: differentiation, D: lymph node metastasis, E: distant metastasis, F: TNM stage. FoxM1 = Forkhead box M1, OR = odds ratio, TNM = tumor node metastasis.