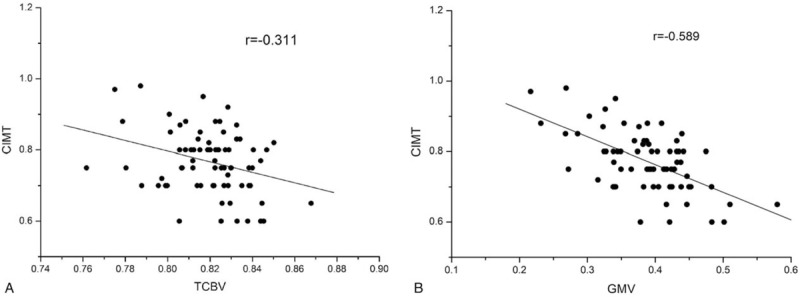
Figure 2.

Scatter plots of the relationship between the characteristics of carotid plaques and the total cerebral brain volume (TCBV). (a) Scatter plot showing the negative relationship between carotid intima-media thickness (CIMT) and the TCBV. (b) Scatter plot showing the negative relationship between CIMT and GMV in the right thalamus.
