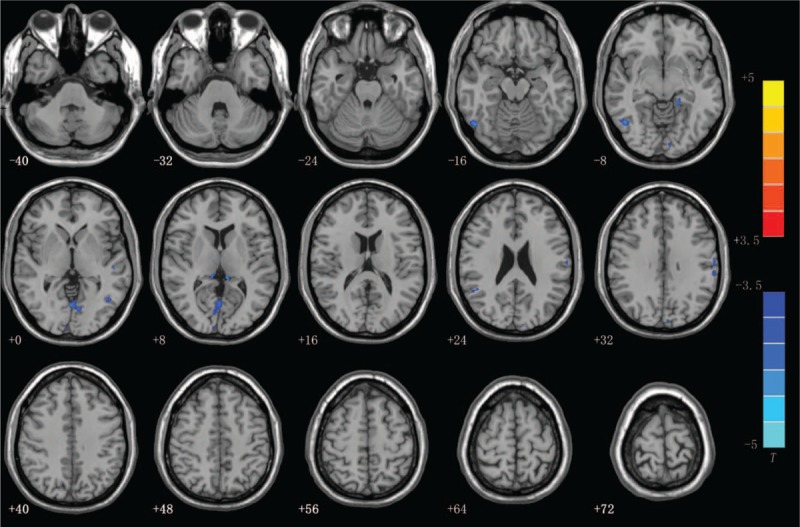
Figure 4.

Axial slices overlaid with regions showing significant differences in gray matter volume (GMV) between the vulnerable plaque patients and the stable plaque patients after controlling for age, sex and intracranial volume. Blue areas represent that the GMVs of stable plaque patients in the right middle occipital gyrus and the bilateral lingual gyrus were less than those of the vulnerable plaque patients. (P < .05, FWE-corrected and FDR-corrected, with a 30-voxel clustering criterion).
