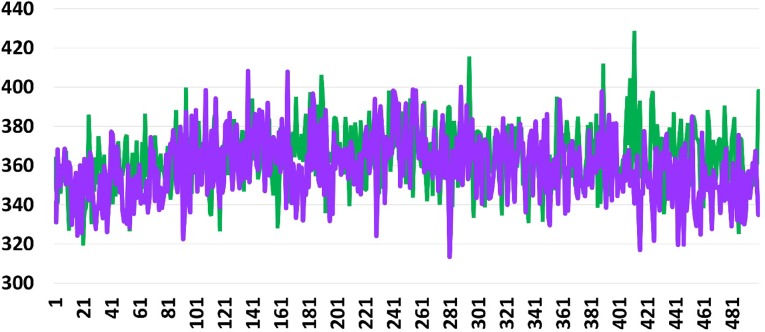
Fig. 12.
Shows bond energy graph of 2-hydroxy-5-[(E)-2-{4-[(prop-2-enamido) sulfonyl] phenyl} diazen-1-yl] benzoic acid and C1 with DNA of Mycobacterium tuberculosis. X-axis and Y-axis represent bond energy and number of trajectory frames respectively. Best docked molecule is in green and C1 is in violet

