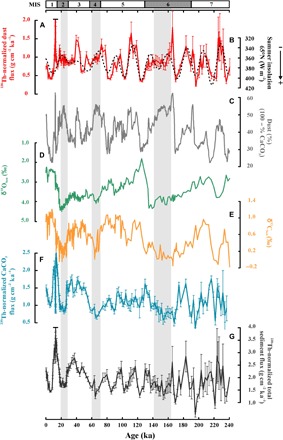
Fig. 2. Dust and paleoceanographic records from core MD03-2705 off West Africa.

(A) 230Th-normalized dust fluxes (red). (B) Northern Hemisphere summer insolation (June-July-August, 65°N; dashed lines) (29). (C) Dust percentages (gray). (D and E) δ18Oben (green) and δ13Cben (orange) values from benthic foraminifera (25). (F and G) 230Th-normalized CaCO3 flux (blue) and total sediment flux (black). All uncertainties are 1-σ. Gray bars highlight periods when high dust percentages occur in association with low 230Th-normalized sedimentation rates and carbonate accumulation rates, indicating that these dust percentage maxima are driven by carbonate dissolution rather than eolian supply.
