
Fig. 3. Plasmax induces cell line–specific transcriptomic alterations and prevents the pseudohypoxic gene expression signature of cells cultured in commercial media.
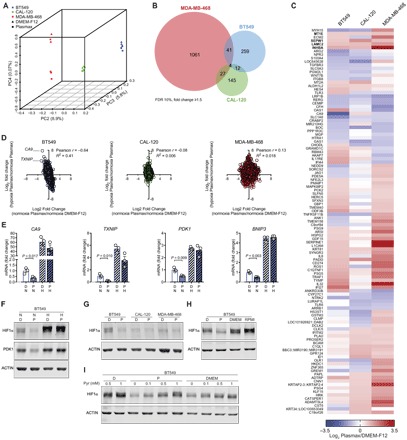
(A) PCA of gene expression obtained from RNA-seq data of BT549, CAL-120, and MDA-MB-468 cells cultured in Plasmax or DMEM-F12, in normoxia. n = 3. Each symbol represents an independent experiment. (B) Venn diagram showing the number of genes that were differentially regulated in these cell lines when cultured in Plasmax and DMEM-F12. (C) Heat map of genes that were significantly [false discovery rate (FDR) of 10%] and coherently regulated (absolute log2 fold change ≥ 0.585) by culturing cells in Plasmax, in normoxia, in at least two of three cell lines. n = 3, log2 (mean fold change). (D) Correlation analysis of genes regulated by hypoxia in Plasmax (y axis) and genes regulated by Plasmax in normoxia (x axis). Each dot represents the mean of three independent experiments. (E) Expression levels of HIF1α target genes CA9, TXNIP, PDK1, and BNIP3 in BT549 cells relative to control condition (normoxia, DMEM-F12). Means ± SEM; n = 3, each dot represents an independent experiment, and P values refer to a two-tailed t test for unpaired homoscedastic samples. (F) Western blot showing HIF1α levels in BT549 cells in Plasmax (P) or DMEM-F12 (D), in normoxia (N) and hypoxia (H). (G) Western blot showing HIF1α levels in BT549, CAL-120, and MDA-MB-468 cells cultured in DMEM-F12 or Plasmax in normoxia. (H) Western blot showing HIF1α levels in BT549 cells cultured in normoxia in DMEM-F12, Plasmax, DMEM, and RPMI 1640. (I) Western blot showing pyruvate-dependent HIF1α levels in BT549 cells, cultured in DMEM-F12, Plasmax, and DMEM in normoxia. (F to I) Images are representative of three independent experiments. P values refer to a two-tailed t test for unpaired homoscedastic samples.