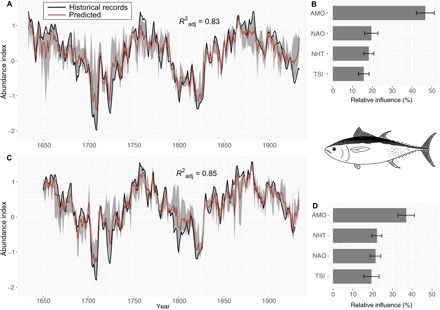
Fig. 1. Ensemble reconstructions of long-term fluctuations in Atlantic bluefin tuna abundance.

(A and C) Historical records (black line) and predicted long-term fluctuations in abundance (averaged prediction as an orange line with 5 and 95% confidence intervals as gray shading) calculated from (A) 1634–1929 (preindustrial tuna fishery period) with no lag and (C) with a one-generation lag (16 years). (B and D) Mean relative influence [and associated SD (standard deviation)] of the four hydroclimatic variables used to reconstruct bluefin tuna abundance.
