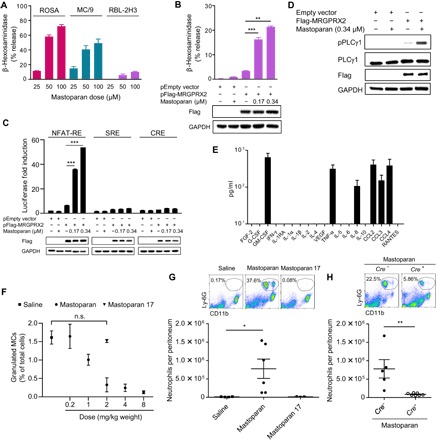
Fig. 2. CTMC activation via MRGPRX2 receptor recruits neutrophils.

(A) Degranulation of a human MC line (ROSA), a murine CTMC line (MC/9), and a rat MC-like cell line (RBL-2H3) in vitro expressed as β-hexosaminidase release by increasing concentrations of mastoparan. (B) Degranulation of RBL-2H3 cells transfected with expression construct encoding MRGPRX2 or empty vector followed by mastoparan stimulation. Immunoblots show the introduction of MRGPRX2 in the cells and glyceraldehyde-3-phosphate dehydrogenase (GAPDH) as a loading control. (C) Luciferase reporter activities triggered by mastoparan in mock- or MRGPRX2-transfected HEK293 cells coexpressing NFAT-RE, SRE, or CRE (representing the Gαq, Gi/o, or Gαs pathway, respectively). Immunoblots show the MRGPRX2 expression and loading control GAPDH. (D) Immunoblot analysis of lysates prepared from RBL-2H3 cells (mock or MRGPRX2 transfected) stimulated with mastoparan for 5 min and probed for phospho-PLCγ1, PLCγ1, Flag, and GAPDH. Data are presented as the mean of triplicate values in one experiment, representative of at least two independent experiments. (E) Cytokines (prestored or de novo synthesized) secreted by a human MC line (LAD2) upon stimulation with mastoparan (25 μM) for 20 hours, measured by a Luminex multiplex fluorescence immunoassay. Data represent mean of triplicate values in a single experiment. (F) Quantification of granulated MCs in the peritoneal lavage of mice 30 min after intraperitoneal injection with various doses of mastoparan (0.2 to 8 mg/kg bodyweight; n = 3) or controls. (G) Numbers of neutrophils per peritoneum 2 hours after intraperitoneal injection with saline or 2 mg/kg bodyweight of mastoparan. Data represent two independent experiments (n = 3 to 6). Flow cytometry plots represent percentages of CD11b+Ly6G+ neutrophils in the peritoneums of each group of mice. (H) Numbers of neutrophils per peritoneum 2 hours after intraperitoneal injection 2 mg/kg bodyweight of mastoparan. Flow cytometry plots represent percentages of neutrophils in peritoneums of MC-sufficient or MC-deficient mice. Data represent two independent experiments (n = 5 to 7). Data were analyzed via unpaired two-tailed Student’s t test or one-way analysis of variance (ANOVA). Error bars represent SEM. *P < 0.05, **P < 0.01, ***P < 0.001, n.s., not significant. IFN, interferon.
