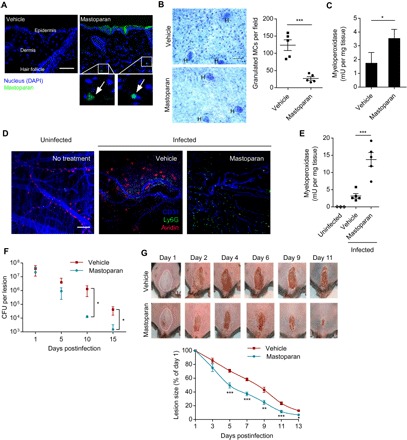
Fig. 3. MCA-mediated neutrophil recruitment accelerates bacterial clearance in the skin.

(A) Representative images of mouse dorsal skin cross sections collected at 2 hours after topical application of 10 μg of mastoparan-FITC or vehicle (n = 2 to 3). Arrows point to the fluorescent peptide detected within dermis. Scale bar, 50 μm. (B) Representative whole-mount images showing granulated MCs in vehicle- and mastoparan-treated ear tissue 2 hours after treatment. “H” indicates hair follicle. Scale bar, 50 μm. Graph shows quantification of granulated MCs in each treatment group (n = 5). (C) Quantification of neutrophils in dorsal skins of each treatment group using MPO assay 6 hours after treatment (n = 3). (D) Representative whole mount of the dorsal skin following no infection or treatment (left), intradermal infection (108 S. aureus) and topical treatment with vehicle (middle), or mastoparan (right). The infected mice were treated twice daily and sacrificed 4 hours after treatment on day 5; skin tissues adjacent to scabs were stained for avidin (red), Ly6G (green), and CD31 (blue). Notice that in the mastoparan-treated tissue, MCs are not visible because they are degranulated, and numerous neutrophils appear in the image. Scale bar, 100 μm. (E) Quantification of neutrophils (MPO) in the skins of each group of mice 4 hours after treatment on day 7 (n = 3 to 5). (F) Quantification of bacteria in the infected skin tissues at different time points after infection (n = 4 to 5). (G) Representative images of skin lesions taken on indicated days after infection and treatment. White dotted lines delineate area of infection on day 1. The graph at the bottom represents size of skin lesions in different treatment groups measured on indicated days and area calculated using ImageJ (n = 10). Data are representative of at least two independent experiments. Data were analyzed via unpaired two-tailed Student’s t test or ANOVA. Error bars represent SEM. *P < 0.05, **P < 0.01, ***P < 0.001.
