
Fig. 5. Treatment with MCA promotes regenerative healing.
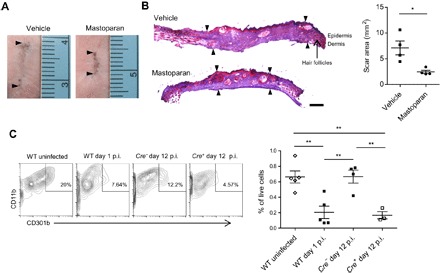
(A) Representative images of skin scars from different mouse groups taken on day 28 after infection. Arrowheads indicate the length of scars. (B) Representative cryosections from scarred regions. The sections taken were perpendicular to the long axis of the scar. Arrowheads define the area of scar regions devoid of hair follicles. Scale bar, 500 μm. The graph on the right represents area of the scar in each group measured using ImageJ (n = 4). (C) Representative flow cytometry plots depicting the CD11b+CD301b+ DDC population in skins of mice of indicated groups. Cells within the CD45+CD64loCD11c+ gate are shown. Graph shows skin CD301b+ DDCs as percentage of total live cells (n = 3 to 5). Data are representative of at least two independent experiments. Data were analyzed via unpaired two-tailed Student’s t test or ANOVA. Error bars represent SEM. *P < 0.05, **P < 0.01. p.i., postinfection; WT, wild type.