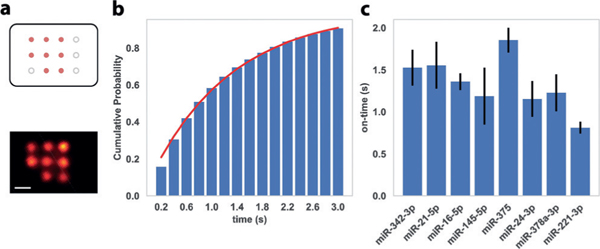
Figure 2.

a) Top, schematic of DNA origami nano-array for blinking kinetics characterization, in which orange dots represent anchor sites with identical miRNA capture sequences and black circles represent boundary markers (not imaged in this experiment). Bottom, representative super-resolution image with a single miRNA species. b) Representative histogram (cumulative distribution function, CDF) of blinking event lengths. Red line represents fit to the exponential distribution for the estimation of blinking on-time. c) Blinking on-times for the 8 miRNA targets in the 8-plex assay, measured with optimized combinations of anchor strands and imager strands. Error bars represent the standard deviations from 3 independent experiments. Scale bar = 20 nm.
