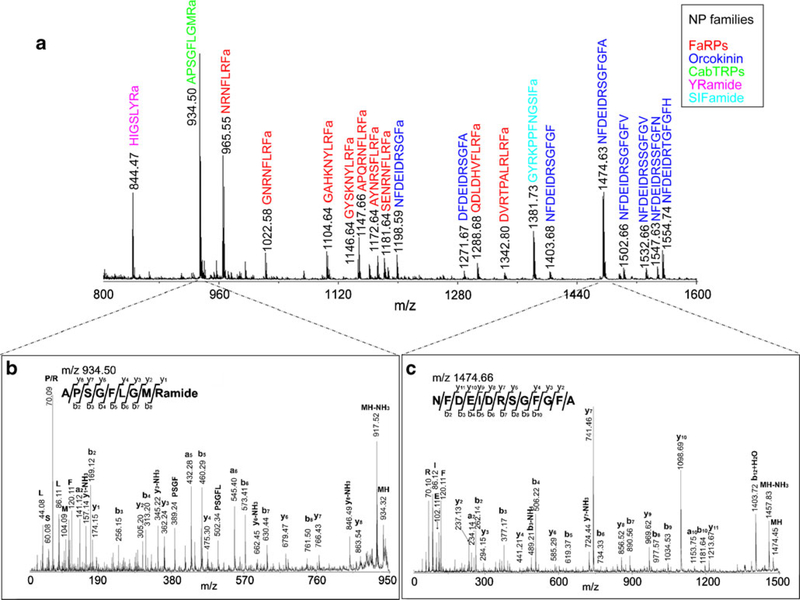
Fig. 2.
Direct analysis of a piece of Cancer borealis brain tissue using MALDI-TOF/TOF. a The mass spectrum shows numerous identified neuropeptides from several different families, which are labeled with their corresponding peptide sequences. Peptides from different families are indicated with different colors. FaRPs, FMRFamide-related peptides; CabTRPs, Cancer borealis tachykinin-related peptides. In situ CID fragmentation enables peptide characterization directly from tissue sample: b APSGFLGMRa (m/z 934.5), and c NFDEIDRSGFGFA (m/z 1474.7). The presence of b- and y-type fragment ions is indicated by horizontal lines above (y ions) or below (b ions) the corresponding amino acid residues in the peptide sequence in each spectrum

