Figure 1.

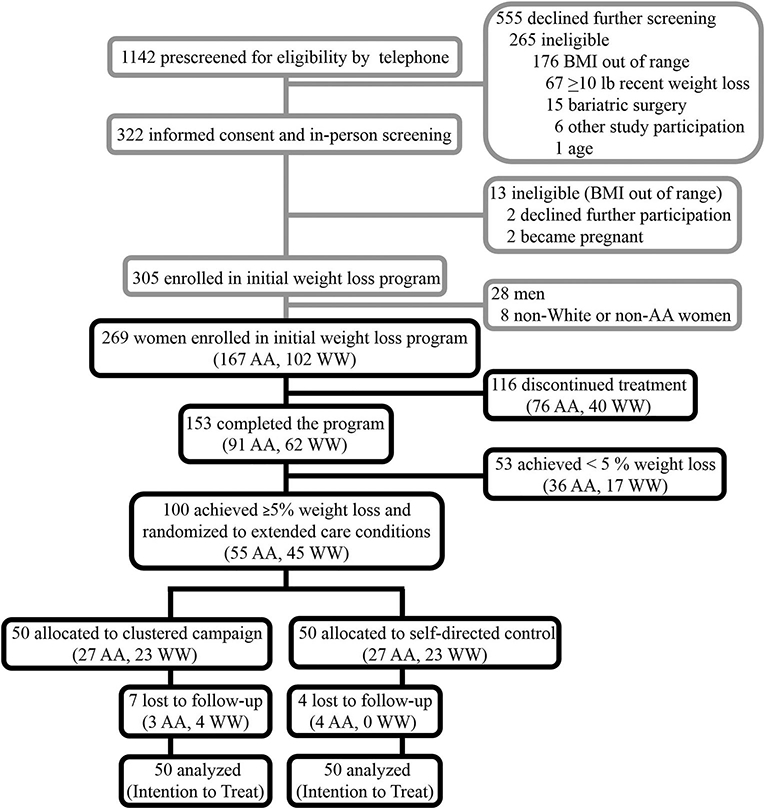
CONSORT flow diagram. The upper grayscale portion of the diagram was adapted from the primary ImWeL findings (Dutton et al. 2017). The lower black portion reflects the enrollment and allocation for the present study.

CONSORT flow diagram. The upper grayscale portion of the diagram was adapted from the primary ImWeL findings (Dutton et al. 2017). The lower black portion reflects the enrollment and allocation for the present study.