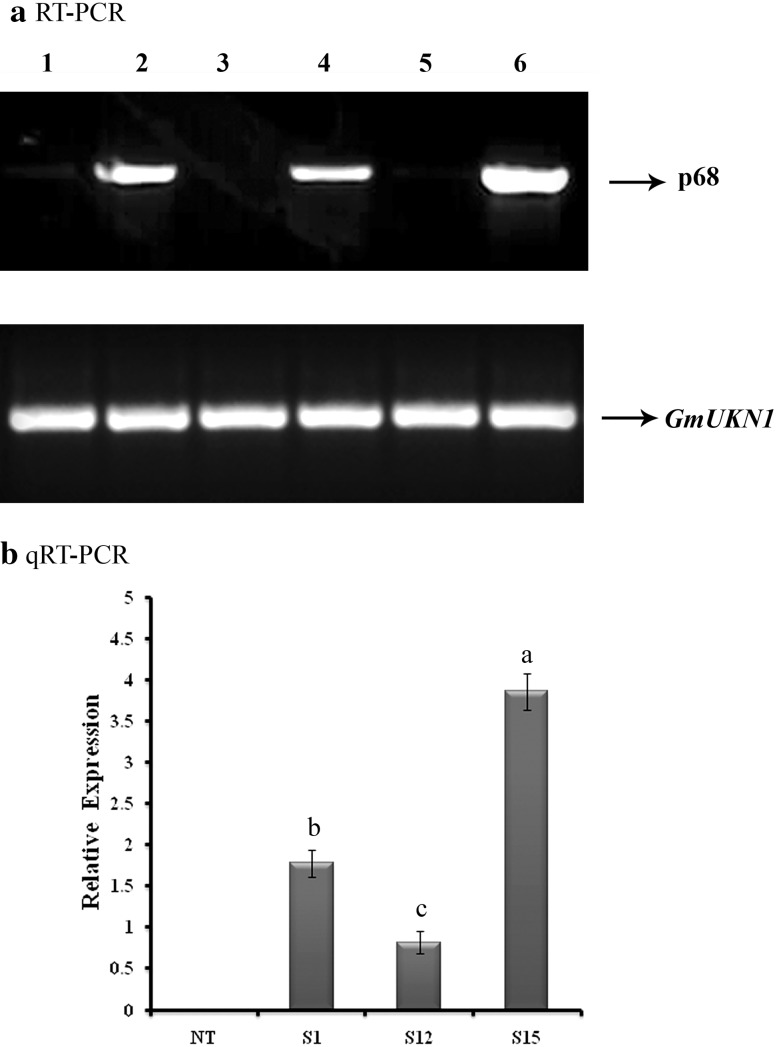
Fig. 3.
Expression analysis of transformed soybean plants. a RT-PCR expression analysis of p68 gene in transformed soybean plants. Lane 1, non-transformed (NT) soybean plant RNA as a negative control; lanes 2, 4 and 6, transformed (T1) soybean (S1, S12 and S15) plant RNA samples; lanes 3 and 5, failed to amplify p68 gene from transformed (T1) soybean (S2 and S13) plant RNA samples. b qRT-PCR analysis to analyze the expression level of p68 gene in transformed soybean plants. Relative expression of three transgenic lines (S1, S12 and S15) and non-transformed (NT) soybean plant; data were analyzed according to the 2− ΔΔCt method. Mean of three individual experiments with standard errors. Different letters denote significantly different values according to Duncan’s multiple range test (DMRT) at a 5% level

