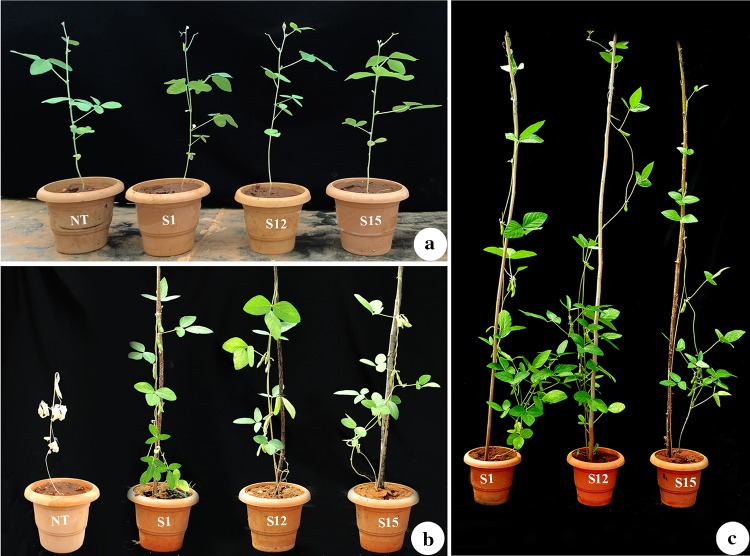
Fig. 4.
Phenotypic appearance of transformed (T1) and non-transformed (NT) soybean plants under salinity stress condition (200 mM NaCl). a Phenotype before salt treatment; b phenotype after two weeks of salt treatment; c green house grown (T1) generation transgenic soybean plants produced soybean pods

