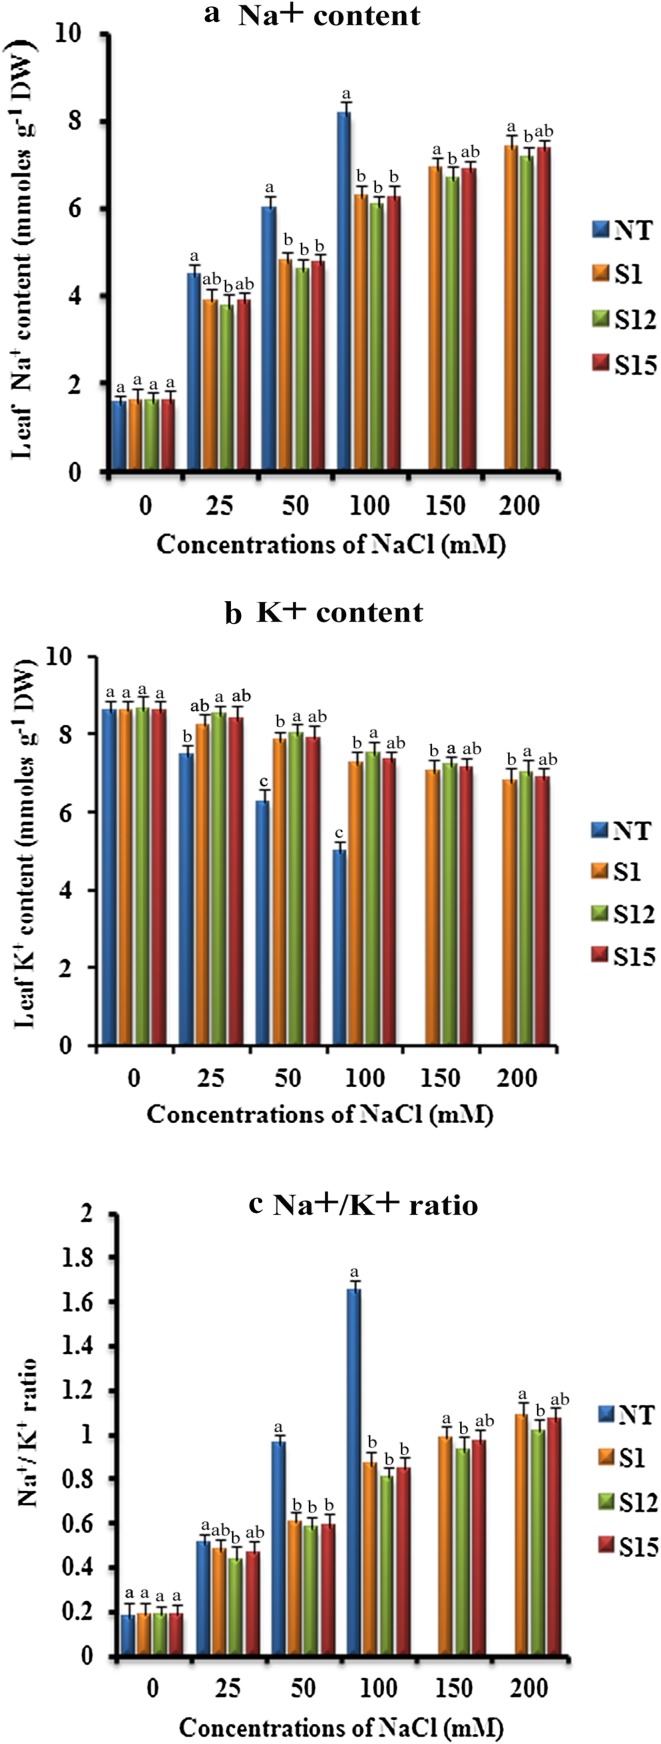
Fig. 9.
Response of transformed (T1) and non-transformed (NT) soybean plants subjected to different concentrations of NaCl for 12 days under greenhouse conditions. a Na+ content (mmoles g− 1 DW); b K+content (mmoles g− 1 DW); c Na+/K+ ratio. Mean of three individual experiments with standard errors. Different letters denote significantly different values according to Duncan’s multiple range test (DMRT) at a 5% level

