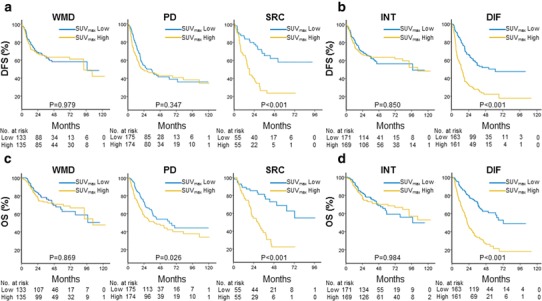
Fig. 2.

Kaplan–Meier survival curves comparing the high- and low-SUVmax groups in each histologic subtype. a, b High SUVmax only had a negative prognostic impact on disease-free survival (DFS) in AGC with SRC histology or diffuse type. c, d High SUVmax only had a negative prognostic impact on overall survival (OS) in AGC with SRC histology or diffuse type
