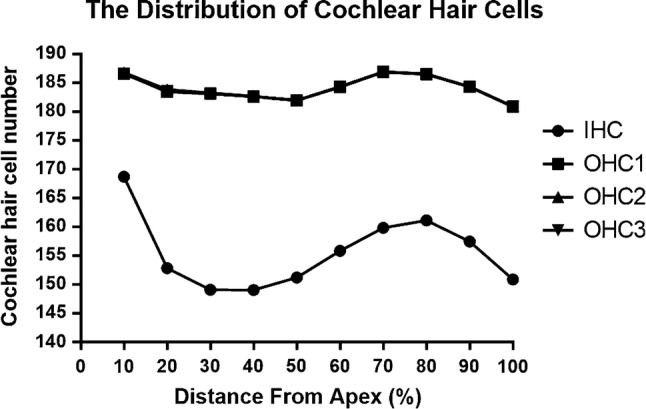
Fig. 3.

Distribution of hair cell densities along the length of the cochlea at 10% intervals. The densities of the IHCs showed a bimodal distribution, with a maximum density at the apex and at 70–80% of the cochlear length from the apex but a reduced density in the remaining cochlea
