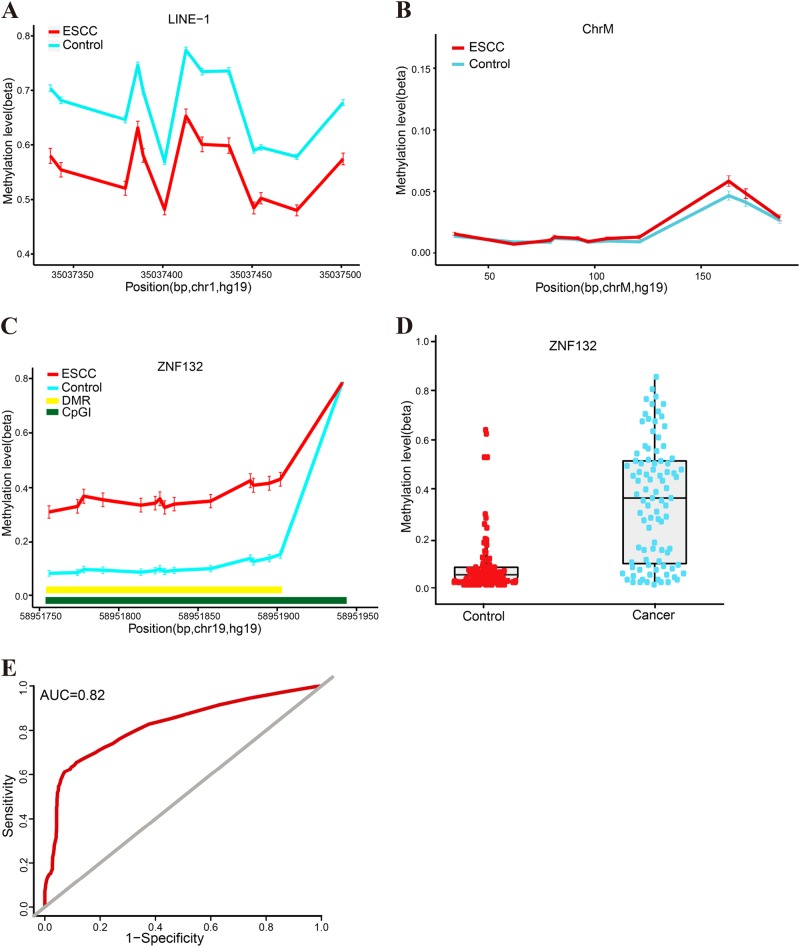
Fig. 1. Hypermethylation of ZNF132 in esophageal squamous cell carcinoma.
a Median % methylation values of 13 CpG site of LINE-1. b Median % methylation of 11 CpG sites of ChrM. c Median % methylation in ESCC and adjacent control tissues of 15 CpG sites of the ZNF132 promoter region (except the last CpG which is hypermethylated in both normal and cancer samples). DMR represents differentially methylated regions and CpGI represents CpG island. d The methylation of ZNF132 in the 91 cases of ESCC and adjacent tissues (each point represents the absolute ratio of methylation in each tissue) e represents the overall ROC (receiver operating characterstics) curve, which was calculated through a logistic regression model, incorporating the mean methylation percentage of the five genomic regions as the variables, and with the adjustment for gender, age, smoking, and alcohol consumption

