Fig. 1.
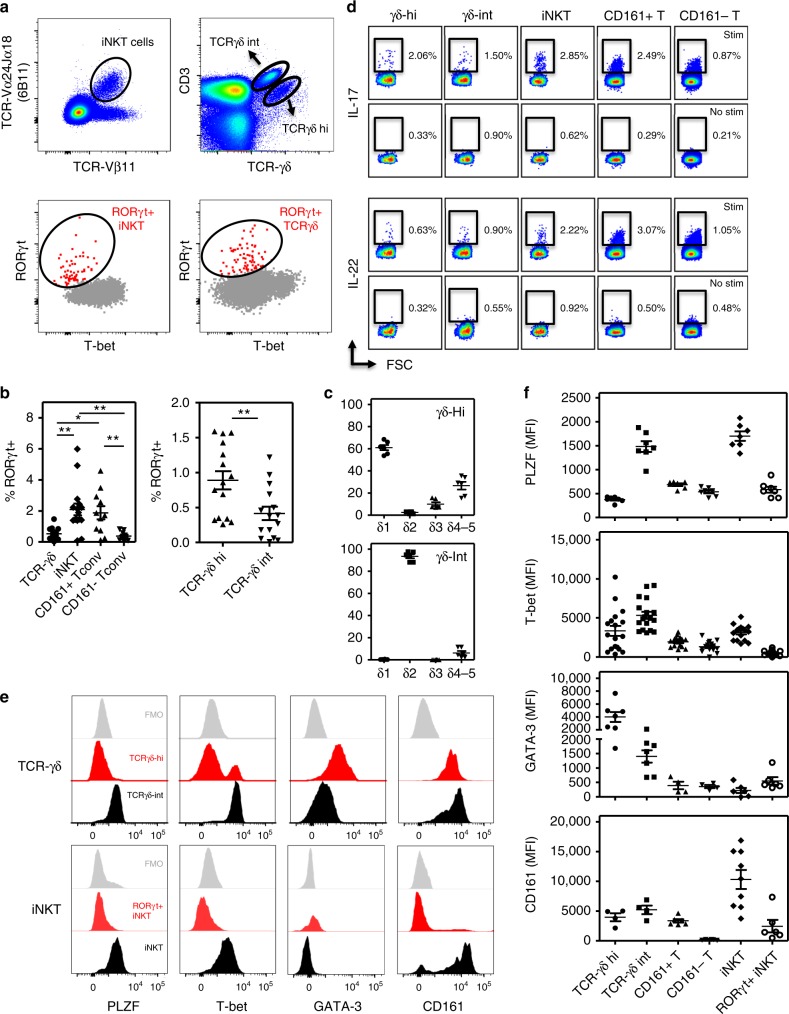
Human blood circulating RORγt+ iNKT and γδ-T cells lack expression of PLZF. a Flowcytometric analyses showing distinct subsets of blood circulating RORγt+T-betlo iNKT and total γδ-T cells (flow plots show representative data from a healthy individual). Gating strategy is shown in Supplementary Fig. 1A. b Percentages of RORγt+T-betlo cells in iNKT (n = 16) and γδ-T cells (n = 15) and CD161+ and CD161- Tconv (n = 11) (left panel; *p < 0.05, **p < 0.01 as determined by ANOVA) and in γδ-T cell subsets (right panel; paired t-test). c TCRVδ profiling of indicated γδ-T cells (n = 6). Representative flow plots are shown in Supplementary Fig. 1B (d) IL-17 and IL-22 production by indicated subsets as measured by intracellular cytokine staining after 4 h incubation of PBMC with PMA/CaI/BFA (stim) or BFA alone (no stim). Results from one experiment are shown (representative for n = 6). Summary data are presented in Supplementary Fig. 1C. e Stacked histograms showing expression levels of PLZF, T-bet, GATA-3, and CD161 measured in iNKT and γδ-T cells (one representative example). f MFI values for indicated markers (as indicated in d). Each dot represents data from one healthy individual (PLZF and GATA-3 n = 7; CD161 n = 9, T-bet n = 16). Overview of statistics (ANOVA) is provided in the Supplementary Table 3. Data throughout this figure are presented as mean ± SEM

