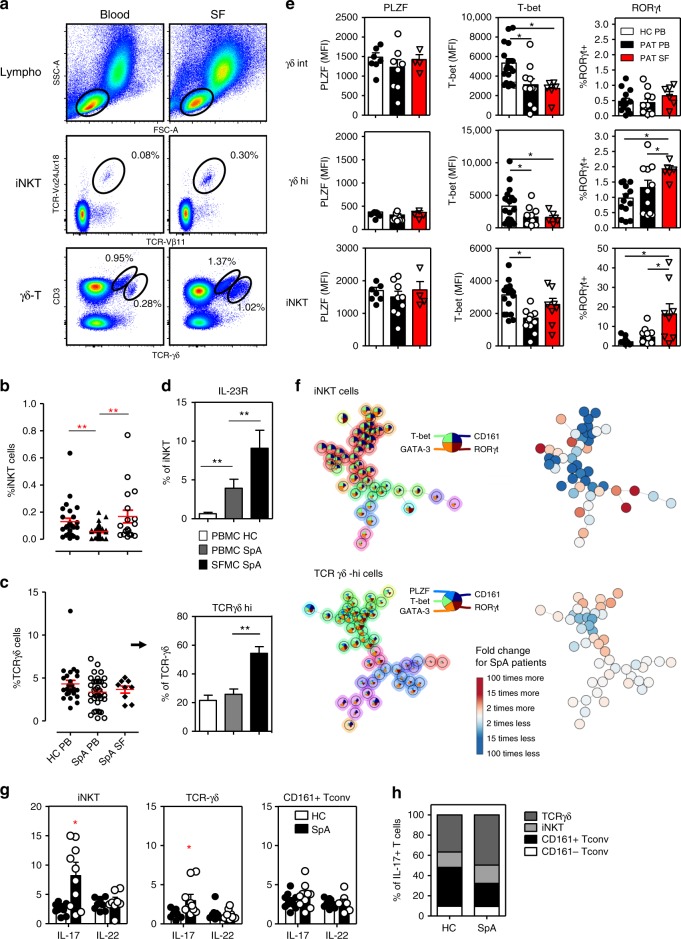
Fig. 3.
iNKT and γδ-T cells in SpA joints show a profound IL-17 signature. a Flowcytometric analyses of iNKT and γδ-T cells in paired PBMC and SFMC derived from a representative SpA patient. b Mean percentage (±SEM) of iNKT cells (relative to total CD3+ T cells) measured in PBMC (SpA, n = 33; HC, n = 27) and SFMC (SpA, n = 18) samples (**p < 0.01 as determined by ANOVA). c Frequency of γδ-T cells and TCRγδ-hi cells (relative to total CD3+ T cells and γδ-T cells, respectively) in PBMC and SFMC samples (ANOVA). d Mean percentage IL-23R+ cells (relative to iNKT cells) measured in PBMC and SFMC samples from B (ANOVA). e Transcriptional factor profile of iNKT cells and γδ-T cells measured in PBMC and SFMC from SpA patients (PB n = 8-12, SF n = 4-8) and HC (n = 8-16). (*p < 0.05 as determined by ANOVA) (HC-PB: white bars, SpA-PB: black bars, SpA-SF: Red bars). f FlowSOM visualization of indicated immune cell population present in the peripheral blood of HC (n = 8) and SpA patients (n = 8), stained for markers indicated in the pie chart. Each circle represents a specific marker combination, corresponding to a specific cell type. The mean marker values are visualized for each node, using star charts. The height of each part indicates the expression intensity: if the part reaches the border of the circle, the cells have a high expression for that marker. The nodes are connected to the ones they are the most similar to. An automatic meta-clustering of the FlowSOM nodes is visualized by the background color of groups of nodes. A parallel tree gives an overview of significantly over-(red) or under-(blue) represented cell types in SpA patients vs. controls. g IL-17 and IL-22 production by peripheral blood iNKT and γδ-T cells from SpA patients (n = 10; black bars) and controls (n = 10, white bars) as measured by intracellular cytokine staining after 4 h incubation of cells with PMA/CaI in the presence of BFA (*p < 0.05, t-tests HC vs. SpA). h Relative representation of indicated peripheral blood T cell subsets among IL-17 producing T cells as measured in PMA/CaI stimulated PBMC from HC and SpA patients (see Supplementary Fig. 6A for individual data points and statistics). Data throughout this figure are presented as mean ± SEM unless stated otherwise

