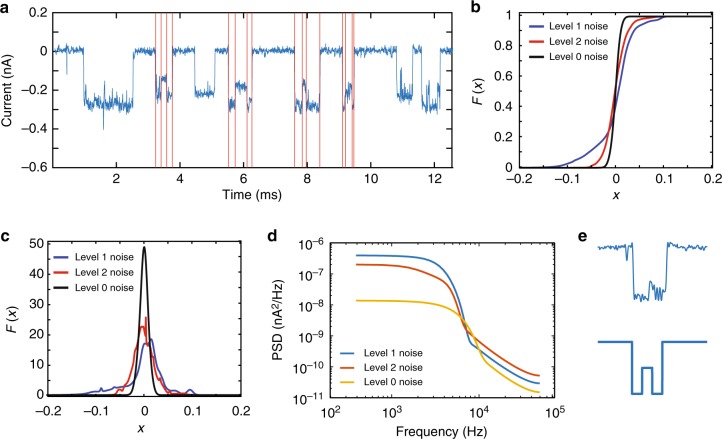
Fig. 3.
a Typical curent trace, with current modulations induced by complexes translocating through a nanopore. Red lines indicate segments of Level 1 and Level 2 in the events. b Cumulative density functions (CDFs) of Level 0, Level 1, and Level 2 noise using a 4-component Guassian mixture model (GMM). c Probability density functions (PDFs) of Level 0, Level 1, and Level 2 noise using a 4-component Guassian mixture model (GMM). d Power spectral density (PSD) of Level 0, Level 1, and Level 2 noise using standard pwelch methods. e A sample “212” event, in which the Level 1 signal is hard to accurately discriminate without the noise spectrum analysis. Source data used to generate this figure can be found in the Source Data file

