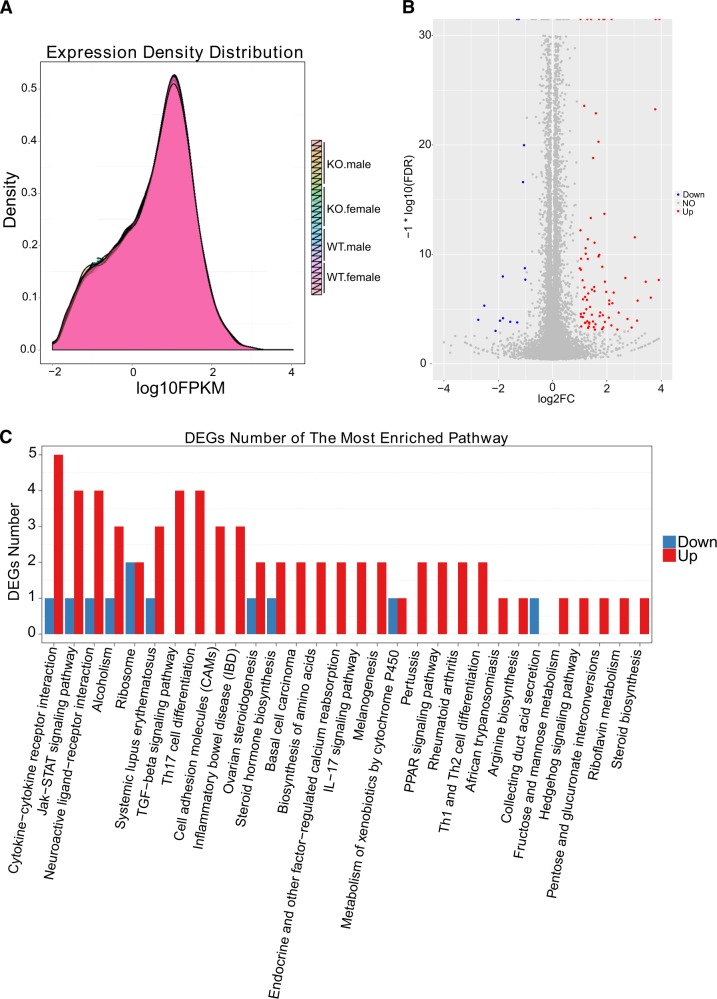
Fig. 3. AIF2 KO has no significant impact on the transcriptome in the cortex of P9 mice.
a The density map shows no difference in the abundance or concentration of gene expression between the WT and KO groups. b Scatter plots of all expressed genes in each pairwise RNA sequence analysis in the cortex of P9 mice. c KEGG pathway enrichment analyses of all significantly altered genes from the cortex. Pathways that are reduced or increased are shown in blue and red, respectively. c No single pathway was enriched by more than five differentially expressed genes (DEGs). The filter criteria were established as a fold change > 2 and q < 0.01. n = 12 for WT (6 males and 6 females), and n = 16 for AIF2 KO (8 males and 8 females)

