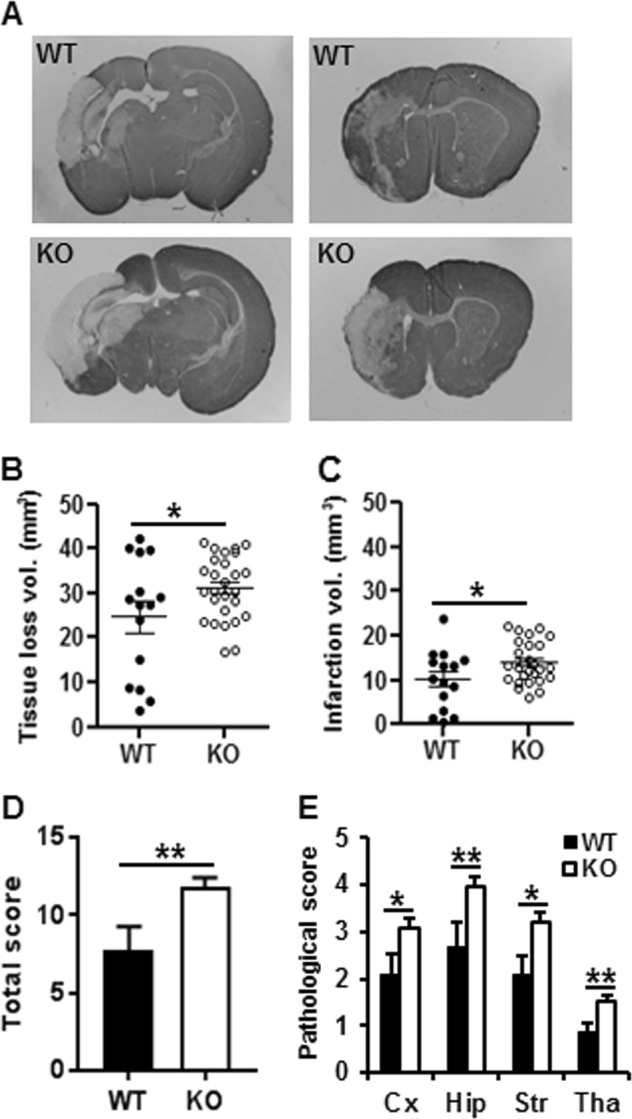
Fig. 5. Knockout of AIF2 increases brain injury in neonatal mice after HI.

a The photomicrographs show representative MAP2 staining at 72 h after HI at the dorsal hippocampus (left panel) and the striatum (right panel) levels in WT and KO mice. b The total tissue loss volume at 72 h after HI (24.7 ± 3.4 mm3 for WT, n = 15 vs. 31.1 ± 1.4 mm3 for AIF2 KO, n = 27, *p < 0.05). c The infarction volume at 72 h after HI (10.1 ± 1.7, n = 15 vs. 13.9 ± 0.9, n = 27, *p < 0.05). d The total pathological score (7.72 ± 1.54, n = 15 vs. 11.77 ± 0.64, n = 27, *p < 0.05). e The pathological scores in the cortex (2.13 ± 0.45 vs. 3.09 ± 0.20, *p < 0.05), hippocampus (2.66 ± 0.52 vs. 3.97 ± 0.21, *p < 0.05), striatum (2.07 ± 0.42 vs. 3.20 ± 0.22, *p < 0.05), and thalamus (0.86 ± 0.20 vs. 1.51 ± 0.13, *p < 0.05) in WT and KO mice at 72 h post-HI
