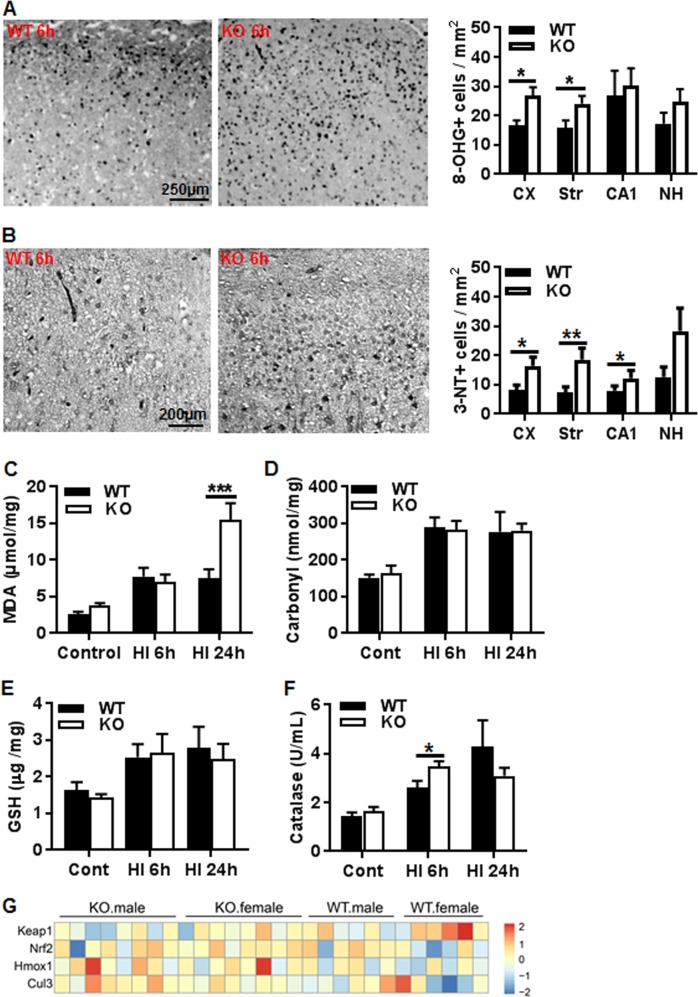
Fig. 7. AIF2 KO induces oxidative stress.
a Representative images of 8-OHG immunostaining in the cortex of WT and KO mice at 6 h after HI. The bar graph shows quantification of the 8-OHG-labeled cells in the cortex (Cx), striatum (Str), hippocampal cornus ammonis 1 area (CA1), and nucleus habenularis (NH) in WT and KO mice at 6 h after HI. n = 6 for WT and n = 7 for AIF2 KO. b Representative images of 3-NT immunostaining in cortex of WT and KO at 6 h after HI. The bar graph shows quantification of 3-NT-positive cells in different brain regions in WT and KO mice at 6 h after HI. n = 6 for WT and n = 7 for AIF2 KO. c Quantification of malondialdehyde (MDA) in WT and KO mice under physiological conditions (Cont) and at 6 and 24 h post-HI. At 24 h after HI, there was a significant increase in KO mice compared to WT littermates (7.53 ± 1.22 vs. 15.44 ± 2.31, ***p < 0.001) n = 5 for WT control and n = 7 for KO control; n = 6 for WT and KO at 6 h post-HI; n = 5 for WT at 24 h post-HI and n = 9 for KO at 24 h post-HI. d Quantification of protein carbonylation in homogenates from WT and KO mice under physiological conditions (Cont) and at 6 and 24 h post-HI. There was a significant increase of carbonylated protein after HI, but no difference between WT and KO. n = 4 for WT control and n = 5 for KO control; n = 6 for WT and KO at 6 h post-HI; n = 5 for WT at 24 h post-HI and n = 9 for KO at 24 h post-HI. e Quantification of glutathione (GSH) in WT and KO mice under physiological conditions (control) and at 6 and 24 h post-HI. There were no significant differences between WT and KO mice (n = 6/group). f Quantification of catalase activity in cortical mitochondrial fraction from WT and KO mice under physiological conditions and at 6 and 24 h post-HI. The activity was increased after HI. It was 25% higher at 6 h and 28% lower in KO compared to WT mice. n = 6 for WT and KO control; n = 4 for WT and n = 7 KO at 6 h post-HI; n = 5 for WT at 24 h post-HI and n = 7 for KO at 24 h post-HI. g. The heat map shows the FPKM of cellular redox capacity-related genes, and no significant differences were detected between the WT and KO groups under physiological conditions. n = 6 for WT males, n = 6 for WT females, n = 8 for AIF2 KO males, and n = 8 for AIF2 KO females

