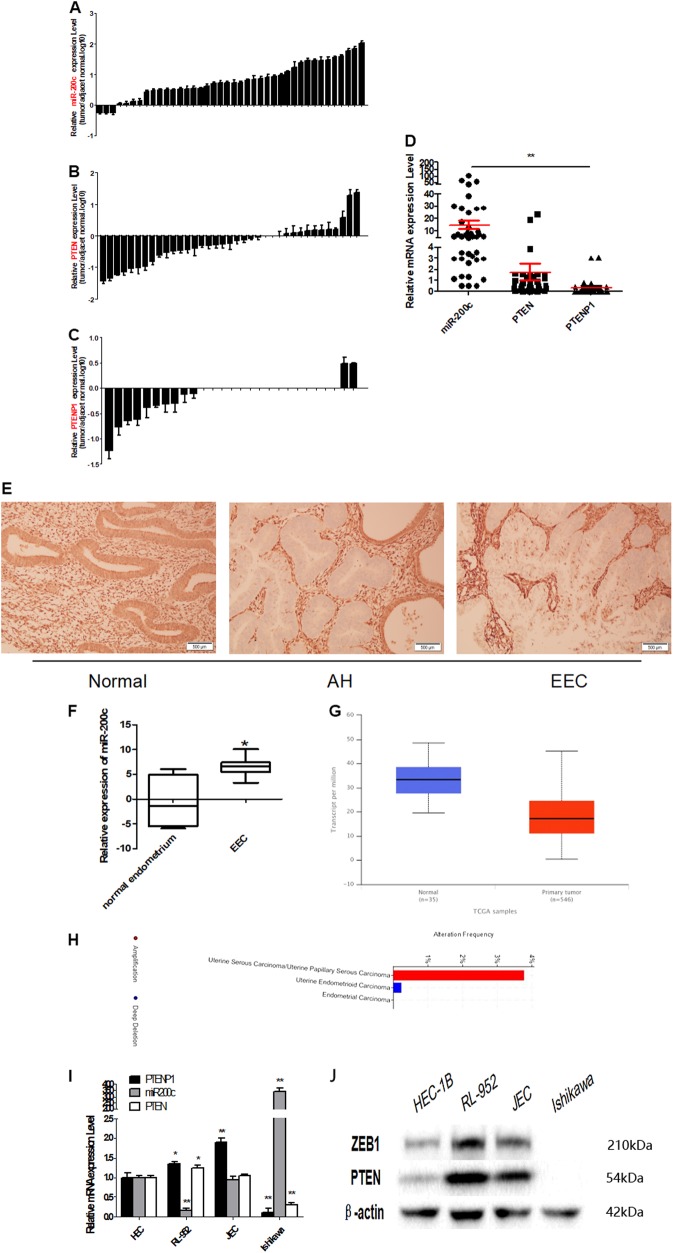
Fig. 1. Inverse expression of PTEN or PTENP1 and miR-200c in EEC tissue samples and cell lines.
a In 37 of 40 EEC samples (92.5%), miR-200c was expressed at higher levels than that in adjacent normal tissues. b In 25 of 37 EEC samples (67.6%), PTEN was expressed at lower levels than in adjacent normal tissues. c In 25 of 27 EEC samples (92.6%), PTEN was expressed at lower levels than in adjacent normal tissues. d miR-200c, PTEN, and PTENP1 expression in 40 cases were analyzed, and showed there was a statistically correlation between their expression. e Immunohistochemistry showed that PTEN was lost in most complex atypical hyperplasia and cancer tissues. f GEO database was used to analyze the expression of miR-200c in EEC. g The expression of PTEN in 546 cases of endometrial carcinoma were analyzed in TGCA database by http://ualcan.path.uab.edu/analysis.html. h TGCA database was used to analyze the PTENP1 expression. i–j In four EEC cell lines the expression of PTEN, PTENP1, and miR-200c was detected by qRT-PCR and western blot. There was an opposite relationship between miR-200c and PTENP1/ PTEN. **P < 0.01

