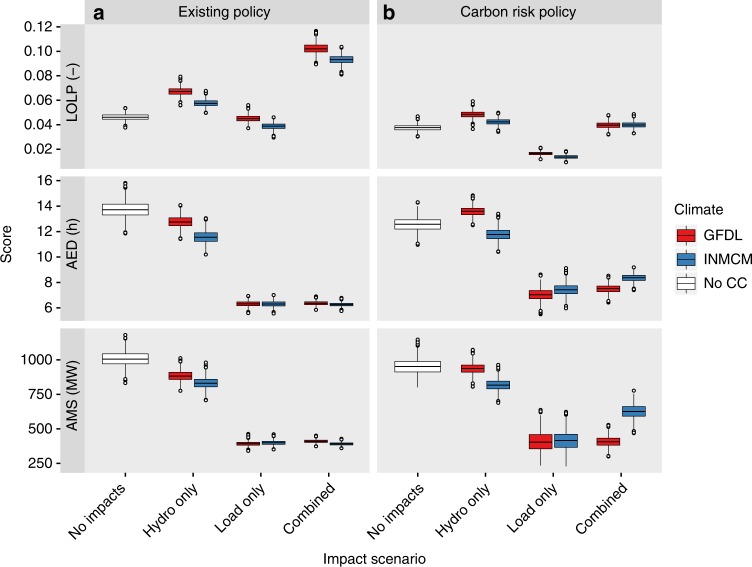
Fig. 2.
Power system adequacy with 2035 infrastructure. Results are given for existing and carbon risk policy scenarios. Metrics are loss of load probability (LOLP), average event duration (AED), and average maximum shortfall (AMS). Uncertainty distributions are derived for each case using a bootstrap with 1000 repetitions. Boxplots follow the Tukey convention, with five summary statistics (median, 25th and 75th percentiles, 1.5* interquartile range) and all outlier points

