
Fig. 5.
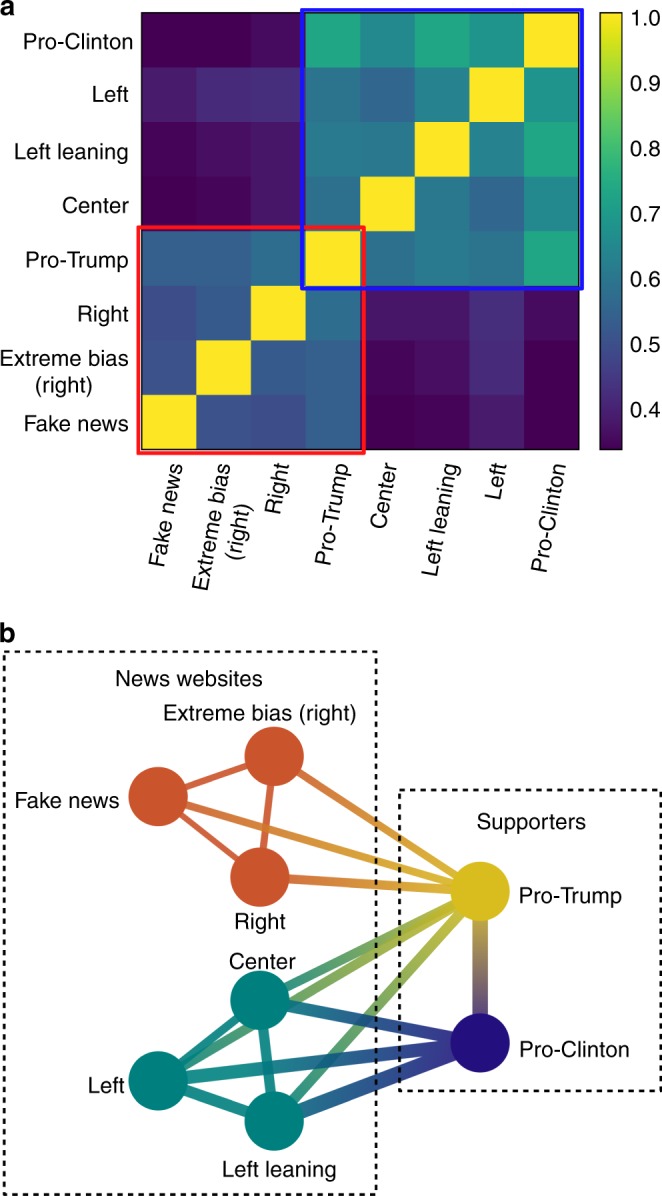
Activity correlation between news outlets and supporters. a Pearson cross-correlation coefficients between activity time series related to the different types of news outlets, Trump supporters and Clinton supporters. b Graph showing the correlation relations between the types of news websites and the supporters. The edges of the graph represent correlations larger than r0 = 0.49. Fake news, extreme bias (right), and right websites form a first cluster, indicated by a red square in a and shown in orange in b, while center, left leaning, and left news websites form a second cluster, indicated by a blue square in a and shown in blue in b. The activity of Trump supporters is equally correlated with all news sources and the activity of Clinton supporters, which represents the largest activity, is mainly correlated with the second media cluster and only poorly with the first one