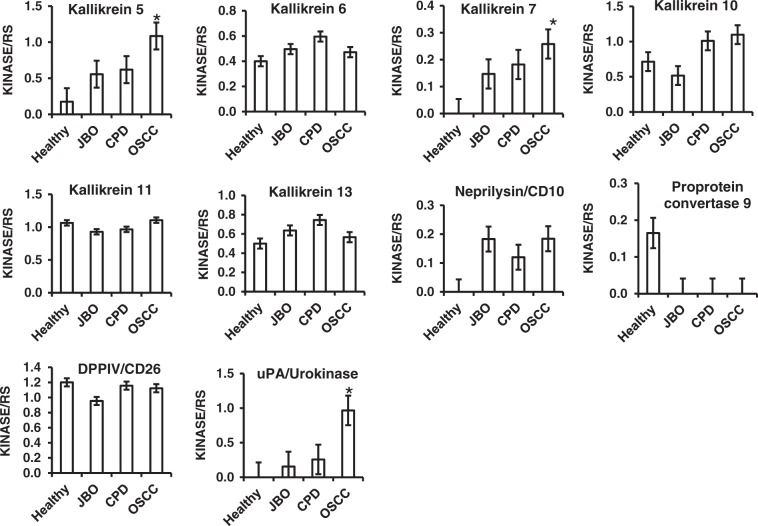
Fig. 3.
Quantitative analysis of kallikrein family, Neprilysin/CD10, Proprotein Convertase 9, DPPIV/CD26 and uPA by human protease array kits The protease profiles of 20 saliva samples from four healthy donors, and four patients each with JBO, OSCC and CPD were analyzed using a human protease array kit. The gray value of each dot on X-ray films, representing every protease in saliva, was measured via densitometry and Image J software. Numerical data are presented as the mean ± standard deviation (SD). The difference among the means was analyzed by one-way analysis of variance (ANOVA). *P < 0.05 compared with healthy donors, or patients with JBO or CPD

