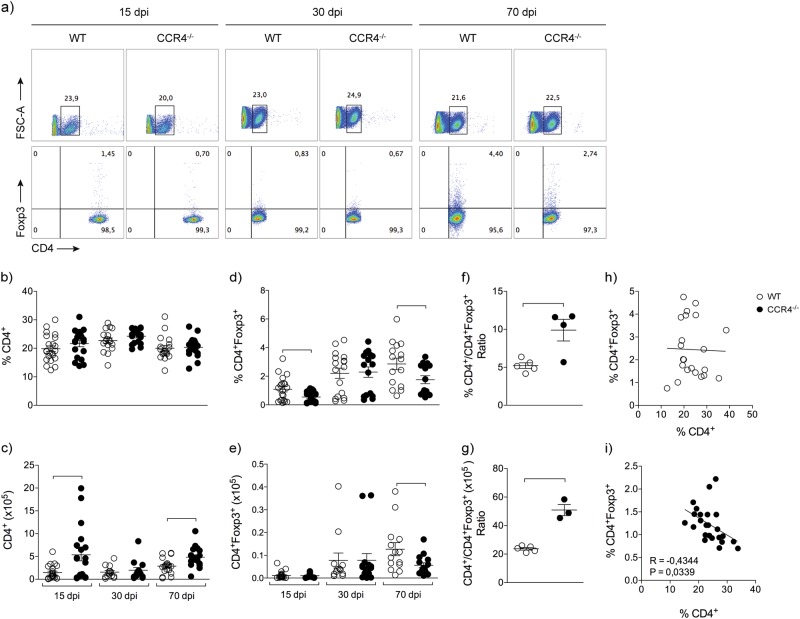
Fig. 3. CCR4 increases lung CD4+Foxp3+ cells during M. tuberculosis infection.
WT (white circles) and CCR4−/− (black circles) mice were infected with M. tuberculosis as described in the Fig. 1. At 15, 30 and 70 days of infection (dpi) the lungs were collected. Representative analysis of CD4+ and CD4+Foxp3+ cells a. Frequency and total number of CD4+ cells b, c and CD4+Foxp3+ cells d, e. Data are representative of three-independent experiments (n = 16–22), expressed as the mean ± SEM. Ratio of frequency f and total number g of CD4+ and CD4+Foxp3+ cells obtained from lungs of infected WT and CCR4−/− mice. Data are representative of one experiment reproduced four times (n = 3–5), expressed as the mean ± SEM. Correlation between the frequency of CD4+ and CD4+Foxp3+ cells from lungs of infected WT and CCR4−/− mice h, i. Data are representative of four-independent experiments (n = 22–25). All data are expressed as the mean ± SEM. Symbols represent individual animals and bars show the difference (P < 0.05) between the groups

