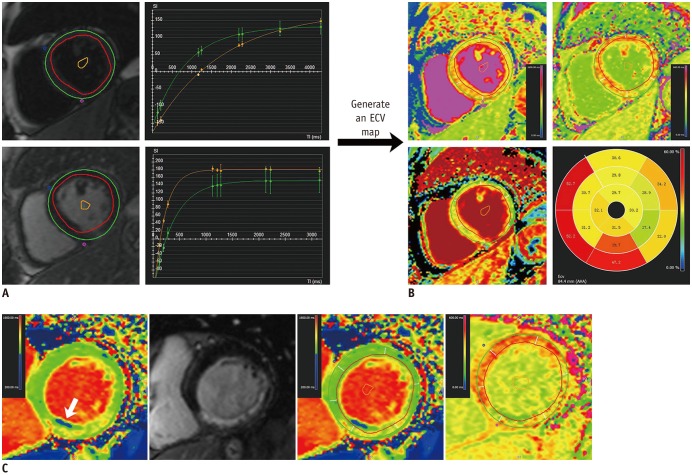
Fig. 1. Measurement of ECV based on AHA 16-segment model in patients with right coronary artery chronic total occlusion.
A. “T1 Calculation” module required endocardial and epicardial contours, segmentation points and blood-pool contour in all slices in both T1 maps. B. “Map Analysis” module generated ECV map and polar map when hematocrit was entered and long axis extent was defined. Note that AHA 2 and 3 segments were located at outflow tract. C. In another case with chronic fatty infiltration (arrow), contours were drawn avoiding zone with abnormal low native T1 times, and copied to matched post-contrast T1 map. AHA = American Heart Association, ECV = extracellular volume fraction

