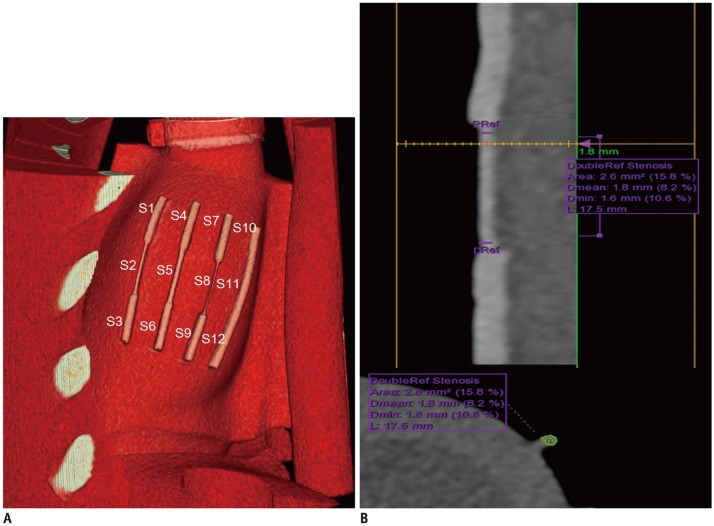
Fig. 2. Volume-rendered curved multiplanar reformatted CT images and transverse section of coronary artery demonstrating segmentations of coronary arteries and measurement of MLD and MLA.
A. Volume-rendering images of heart phantom at HR of 70 bpm demonstrate segmentations of coronary artery. There are 4 coronary arteries in cardiac phantom. Each coronary artery was divided into three segments. Therefore, total of 12 coronary artery segments were analyzed. B. Curved multiplanar reformatted CT images and transverse section of S2 illustrating method used to measure MLD and MLA. When PRef and DRef were set for each segment, software automatically measure MDL and MLA of each segment (yellow line represents narrowest level of S2). In case software presented incorrect centerline or outline, observer was able to adjust it. At HR of 70 bpm, MLD and MLA of S2 were 1.6 mm and 2.6 mm2, respectively. Data in parenthesis (%) represents stenosis percentage using dual reference selection. bpm = beats per minute, CT = computed tomography, Dmean = mean luminal diameter, Dmin = minimal luminal diameter, DRef = distal references, HR = heart rate, L = length, MLA = minimal luminal area, MLD = minimal luminal diameter, PRef = proximal references, S = segment

