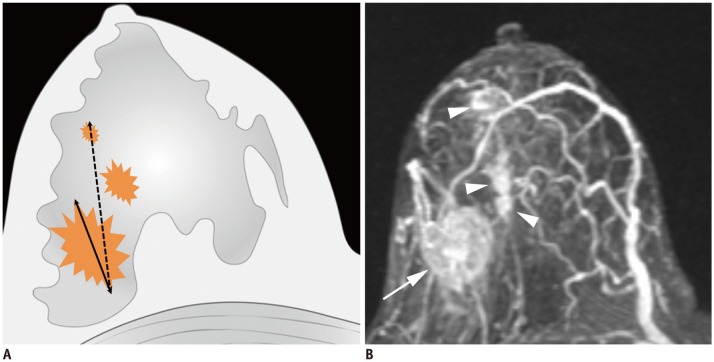
Fig. 2. Determination of T categories.
A. Maximum size of largest tumor is measured (solid line), but size of smaller tumors is not added (dotted line). B. Magnetic resonance maximum intensity projection image demonstrates multiple synchronous tumors in breast. Maximum invasive size of largest tumor is 2.4 cm (arrow), and size of smaller tumors (arrowheads) is not added. Therefore, cT2 (m) is designated for T stage.

