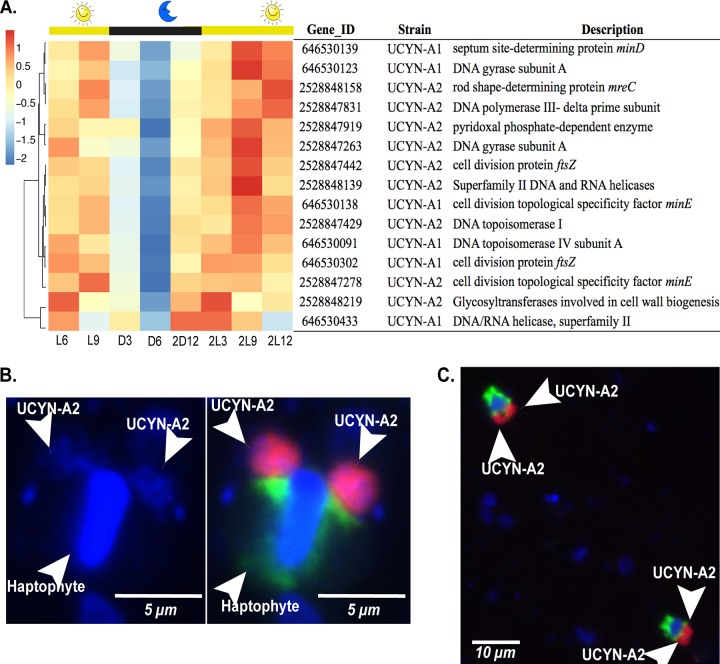
FIG 3.
Transcription of genes for replication and cell division in UCYN-A. (A) (Upper panel) Diel transcription patterns for cell division and replication genes in UCYN-A1 and UCYN-A2 over the light-dark cycle. Hierarchical clustering of genes was based on Pearson correlations between their transcription profiles. The transcription values of the genes were standardized at each time point, and the blue-red scale shows by how many standard deviations a transcription value was lower (blue) or higher (red) than the mean transcription values over the diel cycle (Z score). The Gene ID and the gene product corresponding to each gene for UCYN-A1 and UCYN-A2 are shown. Time periods are indicated on the x axis as “L” (light) and “D” (dark) followed by a number corresponding to the hour after the sunrise and sunset periods started. The second light-dark cycle is indicated as “2D” followed by a number corresponding to the hour of entry into the light or dark period. (Lower panel) Epifluorescence micrographs of dividing UCYN-A2 detected with CARD-FISH (19). (B) Two big clusters of UCYN-A2 cells and the attached haptophyte host. (Left panel) The nucleus of the host and the UCYN-A2 cells were visualized with DAPI stain (blue). (Right panel) The UCYN-A2 strain (red) and its haptophyte host (green). (C) Two different associations of UCYN-A2 with its haptophyte dividing in samples from Scripps Pier.

